
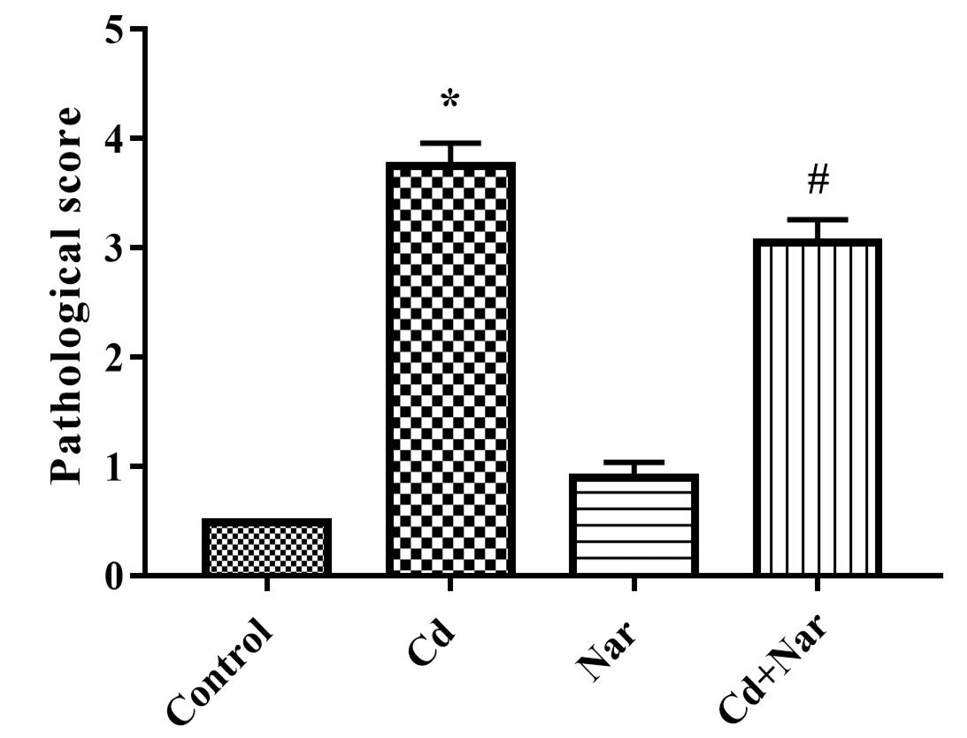
Fig. 4.
The pathological scores of kidney tissues in different treatment groups were evaluated by members of the experimental group, and three independent experiments were repeated. *, indicates significant difference compared with the corresponding control (*P < 0.05). #, indicates statistically significant difference between the Cd and Cd + Nar groups (#P < 0.05).