View larger version:
Download Original File
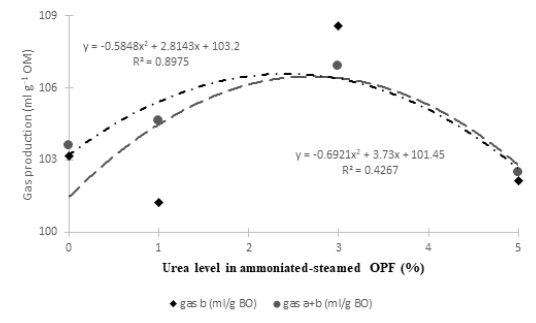
Figure 4:
Graphic representation of gas production profile of b and a+b as a function of urea level.