
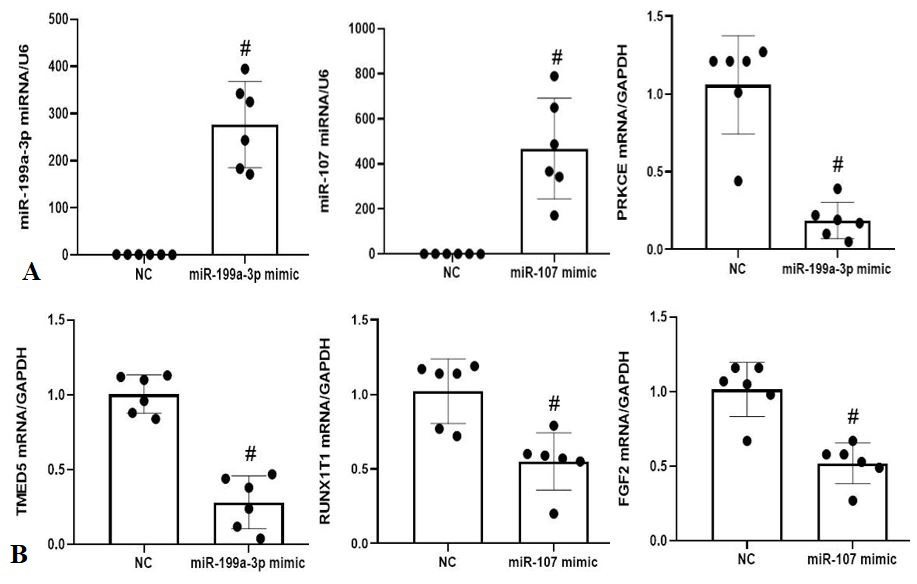
Fig. 4.
The expression levels of target genes (A and B) and (C-F) the alteration of target gene after transfection in WT9-12.
a, miR-199a-3p miRNA; b, miR-107 miRNA; c, PRKCE; d, TMED5; e, RUNX1T1; f, FGF2.
Notes: n= 6 per group. # P <0.05 vs. NC. Data are Mean ± SE. Similar results were obtained after repeating the experiment three times.