
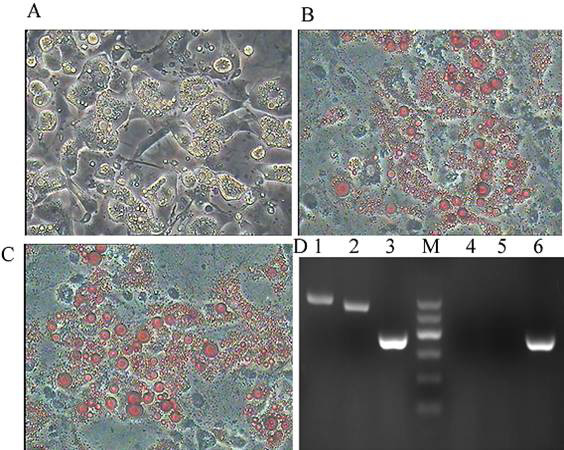
Fig. 7.
Adipogenic differentiation of CPSCs. After induction for 15 days, many big bright lipid droplets were observed in the cells. A–C, The induced cells were oil red O positive (100 ×). D, RT-PCR revealed the expression of the adipocyte-specific genes lane 1 LPL and lane 2 PPARγ in cells from the induced group, whereas these genes were not expressed in cells from the control group (lane 4 and 5). GAPDH served as the internal control (lane 3 and 6).