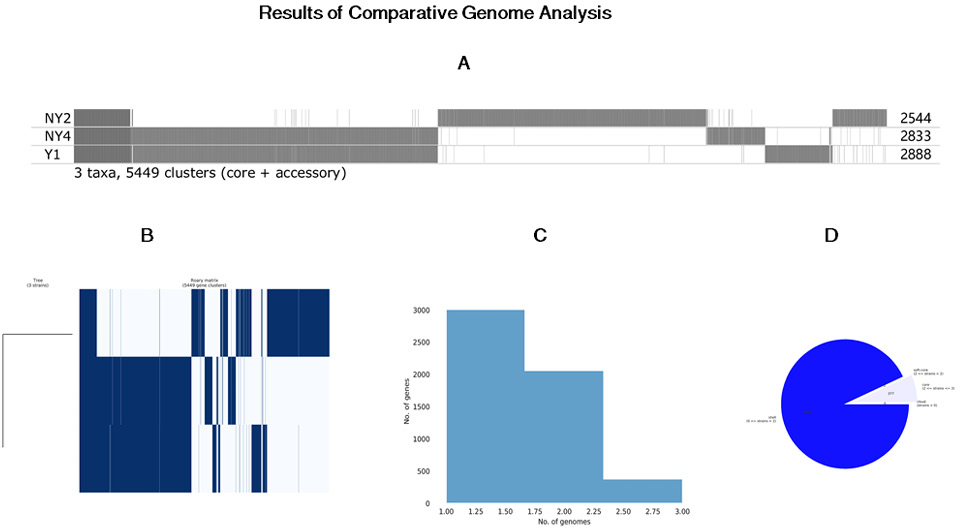
Comparative genome analysis of the three Lactobacillus casei Group (LCG) strains. (A) Roary matrix. Pan-genome analysis of three Lactobacillus casei Group (LCG) strains annotated genomes. Roary produced the gene presence/absence matrix. A total of 5449 protein-coding gene sequence clusters produced by Roary are shown in the figure. The presence of the gene is represented by grey color while the absence is shown by white color. The numbers represent clusters in each assembled annotated genome. (B) Pan-genome constructed by Roary based on the core and accessory genes showing phylogenetic relatedness of the strains by blue (present) and white (absent (C) Barplot indicating the ratio of number of genome vs the number of genes (D) The pan-genome pie chart showing gene content visualized with the use of Roary software.