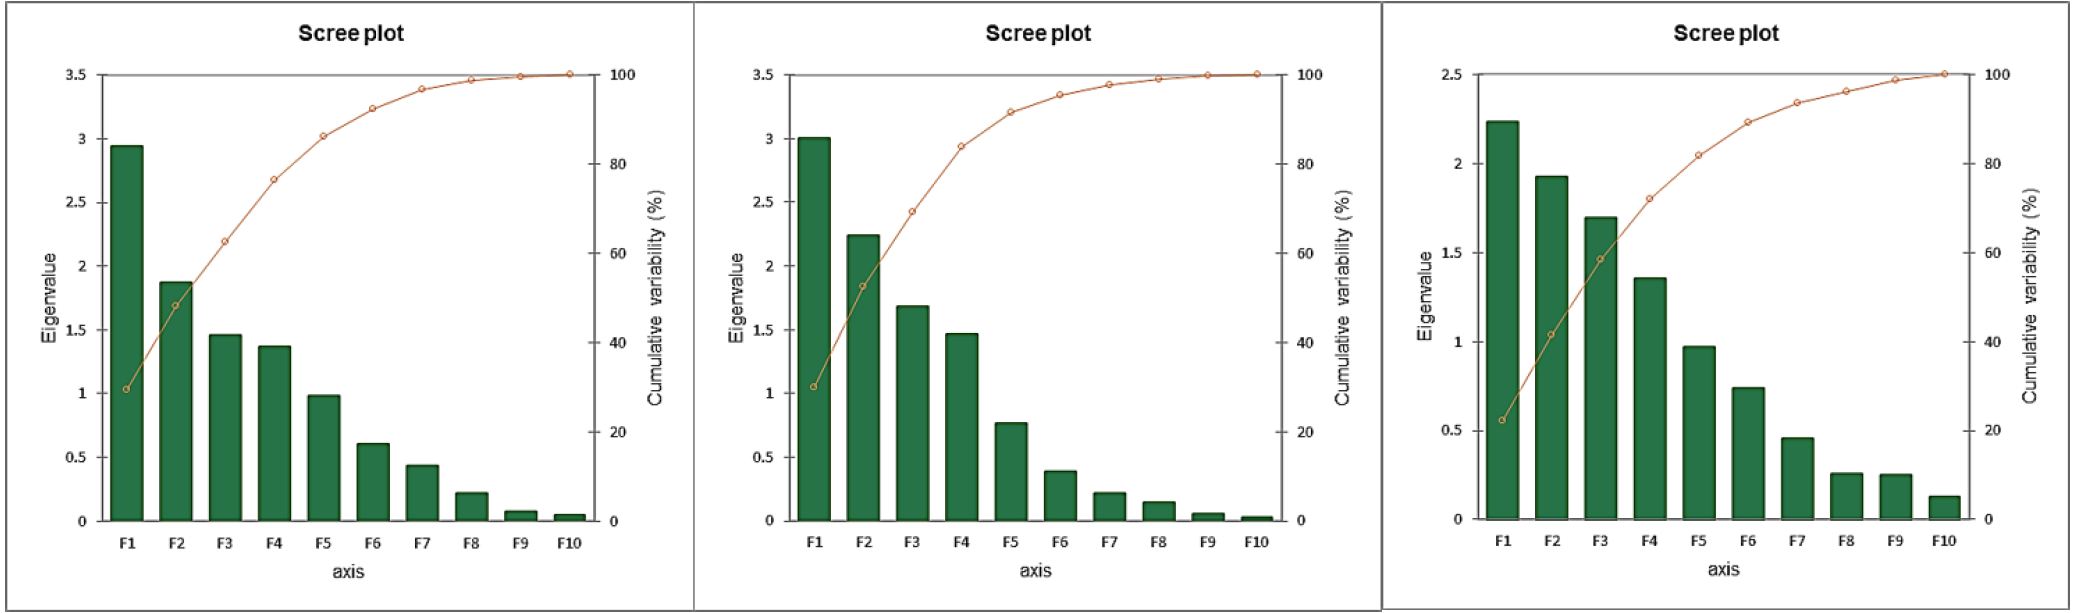
Figure 4:
Eigenvalues of all components in PCA for all the three years (left to right) indicating the proportions of total variance attributed to studied ten traits in target genotypes.
Eigenvalues of all components in PCA for all the three years (left to right) indicating the proportions of total variance attributed to studied ten traits in target genotypes.