View larger version:
Download Original File
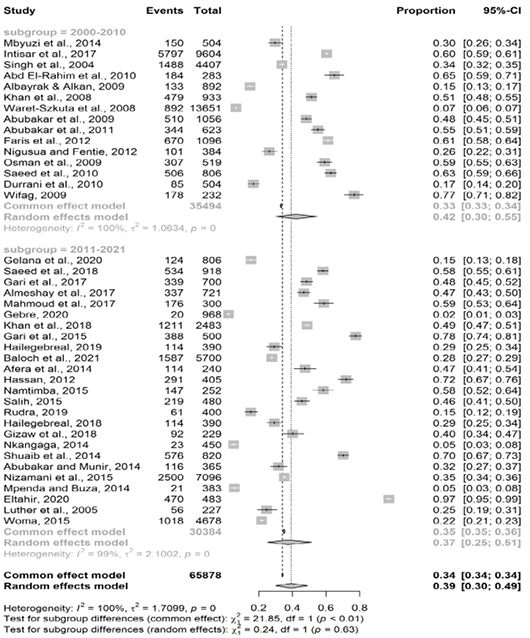
Figure 6:
The forest plot demonstrates the prevalence of PPR according to study period.
