View larger version:
Download Original File
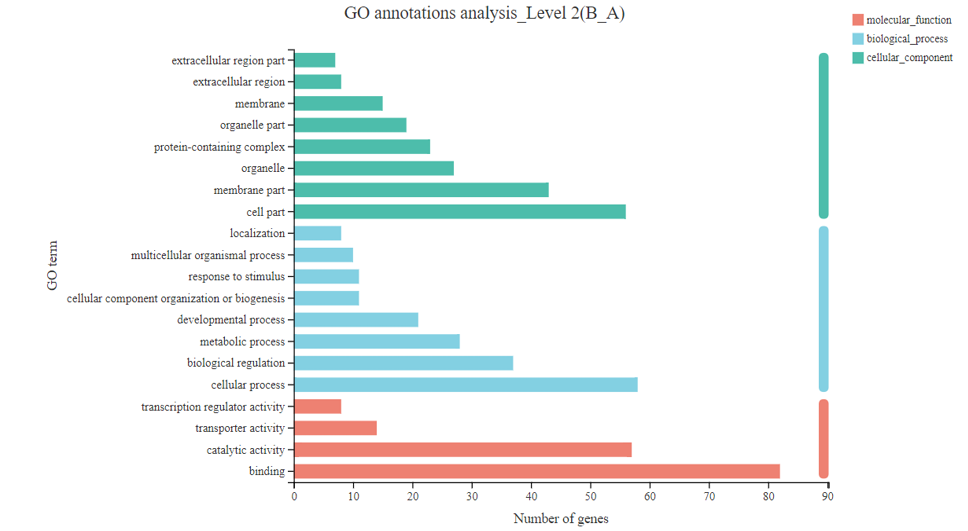
Fig. 5.
GO functional distribution of differentially expressed genes in E. fuscoguttatus unigene.