
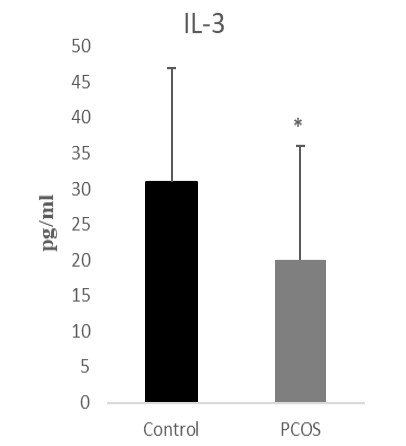
Figure 3:
Mean serum level of IL-3 in PCOS patients as compared to control subjects. Values are expressed as Mean ± SD and comparison is made by two-tailed T-Test. *P<0.05
Mean serum level of IL-3 in PCOS patients as compared to control subjects. Values are expressed as Mean ± SD and comparison is made by two-tailed T-Test. *P<0.05