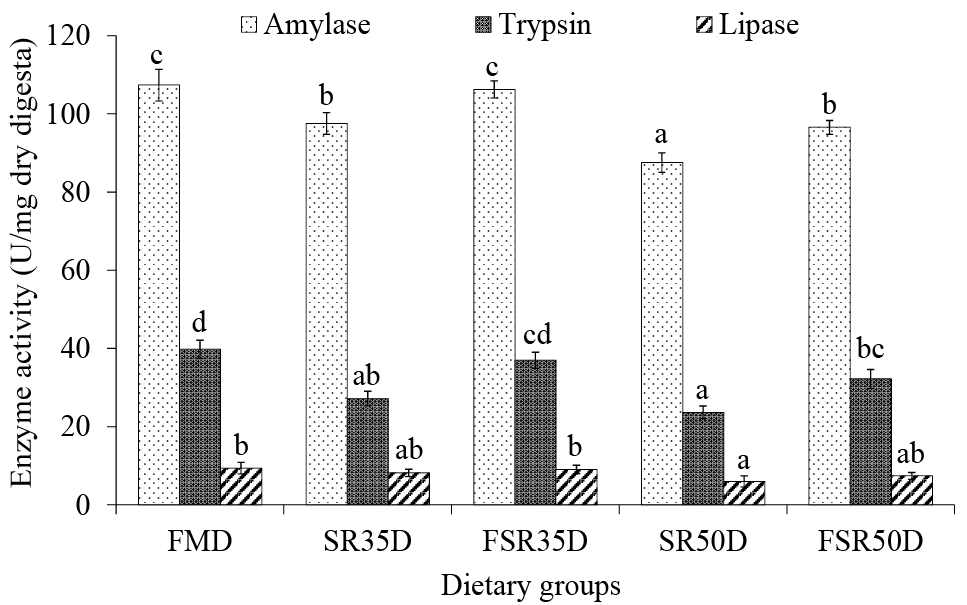
Fig. 2.
Digestive enzyme activities in anterior intestinal digesta of red tilapia fed the experimental diets. Values are presented as means and standard deviations (n = 6). Bars assigned with different letters within each enzyme activity denote significant differences (P < 0.05).
For details of groups, see Table II.