
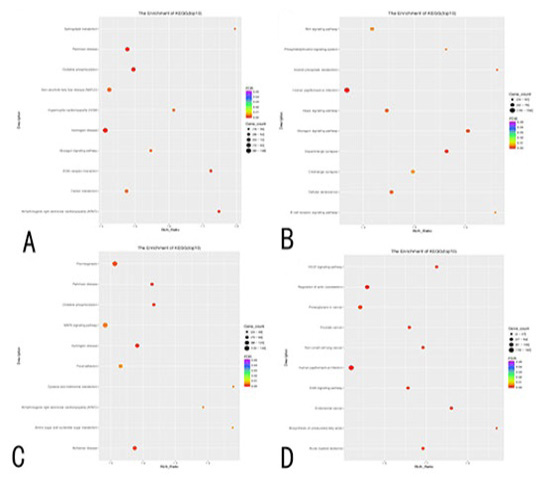
Histogram (Top 10) of KEGG enrichment values in four groups. Annotation of DEGs in KEGG. (A) E8Y_vs_E8X; (B) E16Y_vs_E16X; (C) MLY_vs_MLX; (D) BLY_vs_BLX. In the figure, the path case of the differential top10 is collected, and each circle represents a KEGG path whose name appears on the left legend. The transverse coordinate is the enrichment factor, showing the ratio of the DEGs in the pathway to all DEGs in all pathways to the ratio of genes in the pathway to all genes in all pathways. The larger the enrichment factor, the more important the path is. The color of the circle represents the q value, the adjusted p-value by multiple hypothesis tests; the smaller the q value, the more important the path. The size of the circle represents the number of genes expressed with the differences annotated by the pathway; the larger the circle, the greater the number of genes.