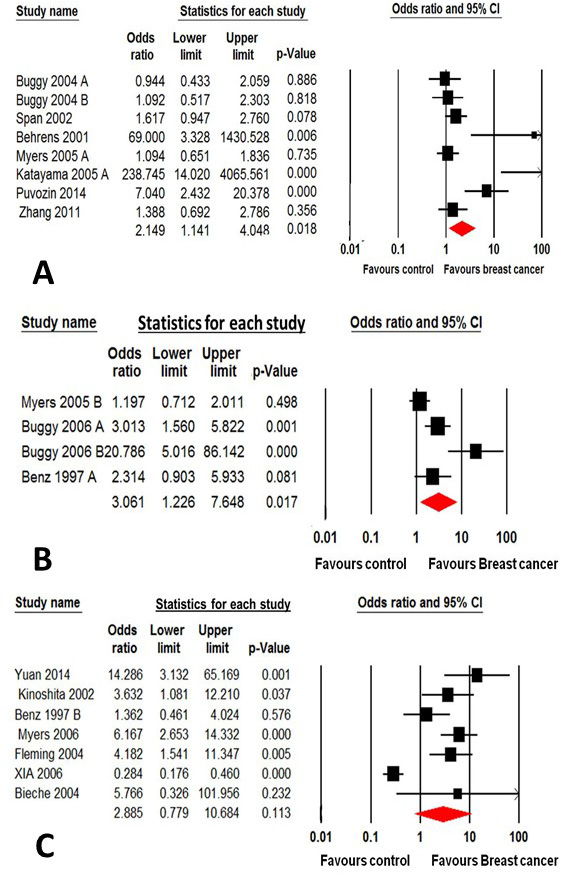
Fig. 3.
Forest plot of odd ratio with a random-effects model for prognosis between increased expression of Ets-1 (A), Ets-2 (B) and ETV-4 (C) and control in breast cancer.
Forest plot of odd ratio with a random-effects model for prognosis between increased expression of Ets-1 (A), Ets-2 (B) and ETV-4 (C) and control in breast cancer.