
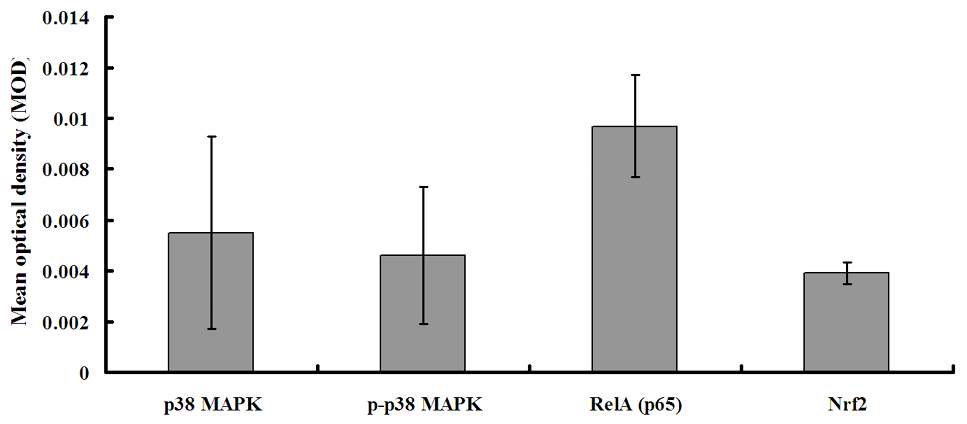
Fig. 2.
Tissue distribution of signaling pathway-related proteins in hepatopancreas of red swamp crayfish (P. clarkii). Expression levels were quantified as mean optical density (MOD) value of the immunopositive cells. Data were expressed as the mean ± SD (n = 6).