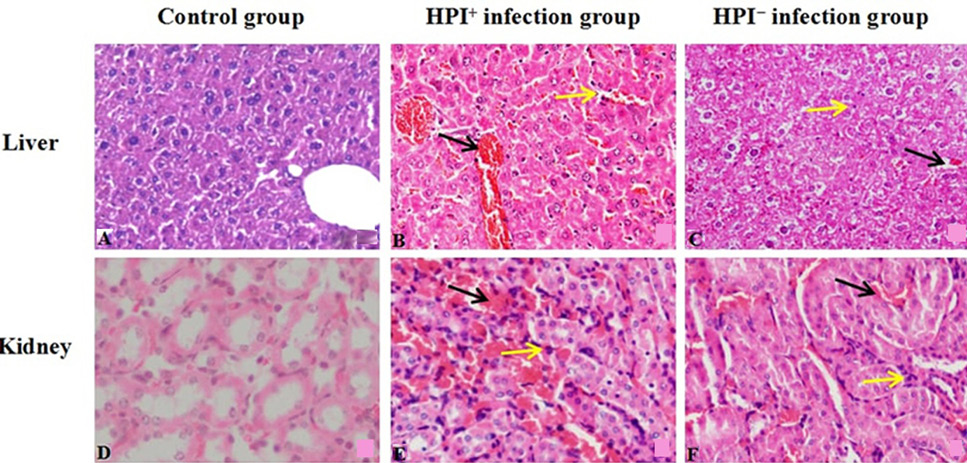
Fig. 7.
Histopathology observations of liver and kidney in mice (HE, 400×); A, liver of control group; B, liver of HPI+ -infection group; C, liver of HPI--infection group; D, kidney of control group; E, kidney of HPI+-infection group; F, kidney of HPI--infection group). Black arrow indicates red blood cells; yellow arrow indicates lymphocyte infiltrations.