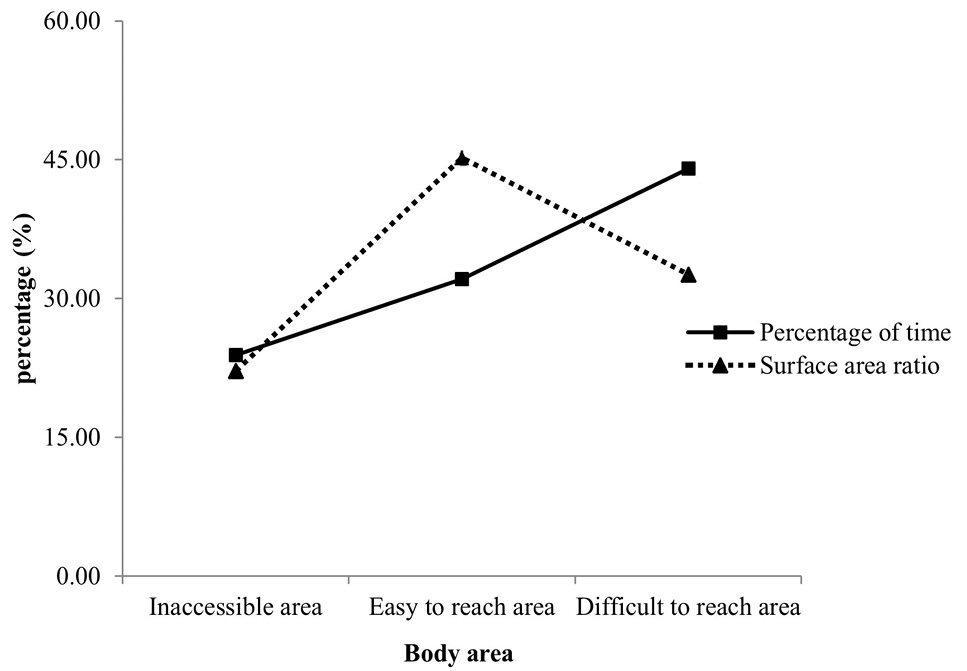
Fig. 2.
Line chart of surface area and time percentage of different grooming areas of white-headed black langur. The dash line and solidate line show the time spent was disproportion to body site area. Thus, difficult to reach area was preferred during grooming.
