
Figure 9:
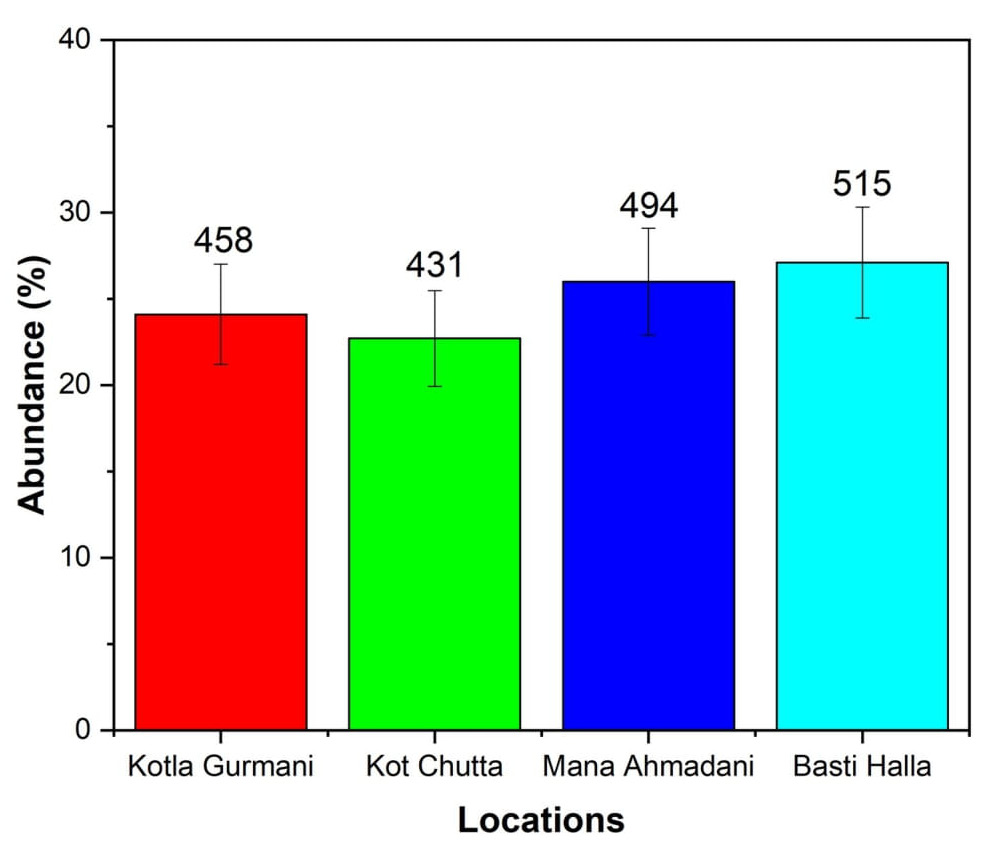
Intercropping effect on abundance of mite families in different locations. The error bars represent standard errors of mean values.
Intercropping effect on abundance of mite families in different locations. The error bars represent standard errors of mean values.