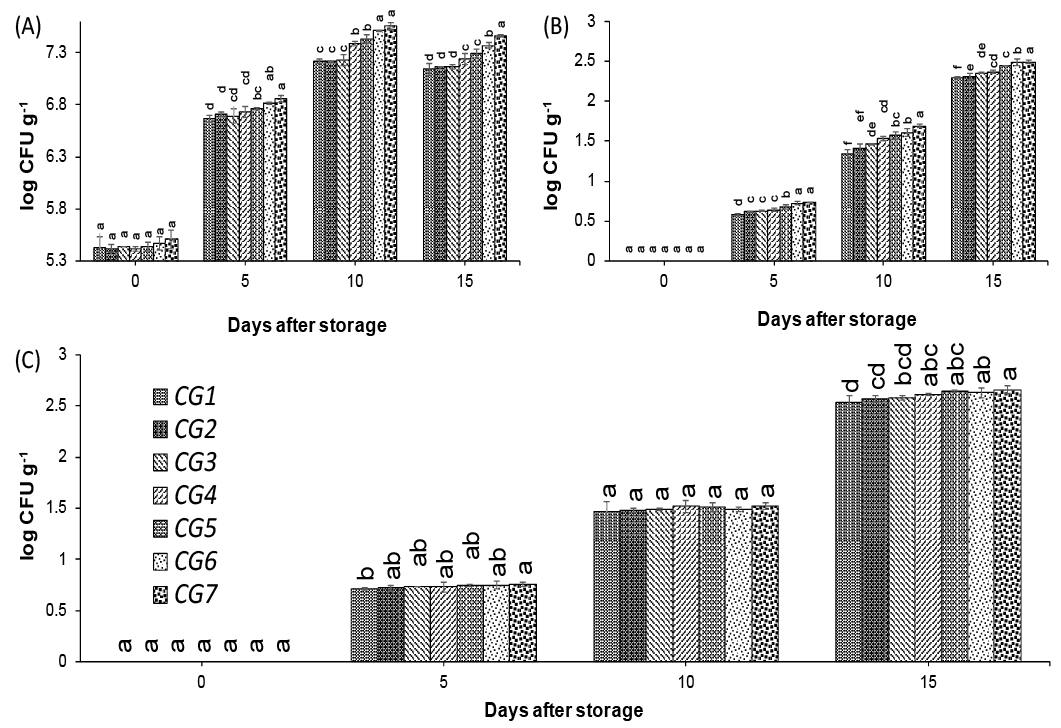
Figure 3:
Effect of cow and goat milk blend in different concentrations CG1 (100:0), CG2 (90:10), CG3 (80:20), CG4 (70:30), CG5 (60:40), CG6 (50:50), CG7 (0:100) on (A) Total viable cell count, (B) Enterobacteriaceae, and (C) Ash content Yeasts and Molds of cottage cheese during 15 days storage at 5±1oC. Vertical bars represent standard error of means for three replicates. Different letters show significant difference among mean values using LSD at (P ≤ 0.05).
