
Figure 2:
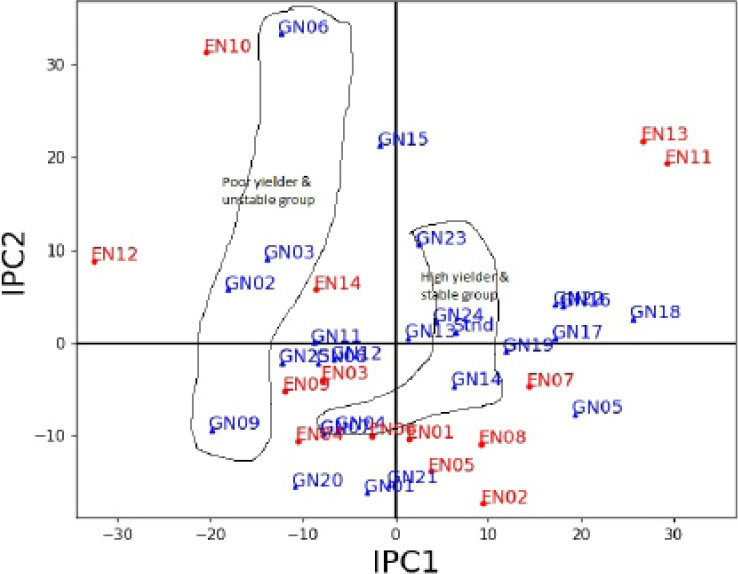
AMMI-2 biplot indicating IPCA-1 (Interaction Principal Component Axis-1) scores in abscissa and IPCA-2 scores on the ordinate axis. Two groups (high yielder & stable) and (Poor yielder & unstable) are encircled separately.
AMMI-2 biplot indicating IPCA-1 (Interaction Principal Component Axis-1) scores in abscissa and IPCA-2 scores on the ordinate axis. Two groups (high yielder & stable) and (Poor yielder & unstable) are encircled separately.