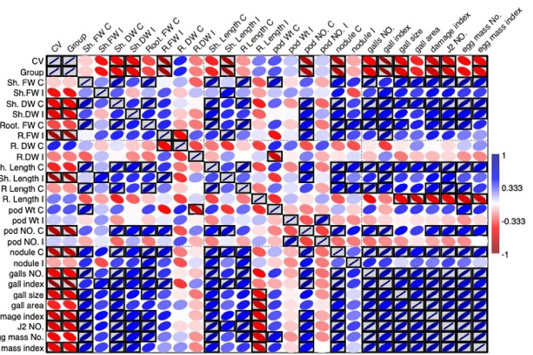
Figure 7:
The blue/red heatmaps present the interactions between the studied variables. The blue color indicates a positive direct correlation, the red color indicates a negative inverse correlation, and the white color indicates no correlation. The gray boxed colors indicate significant correlations according to a 2-tailed significance test.
