View larger version:
Download Original File
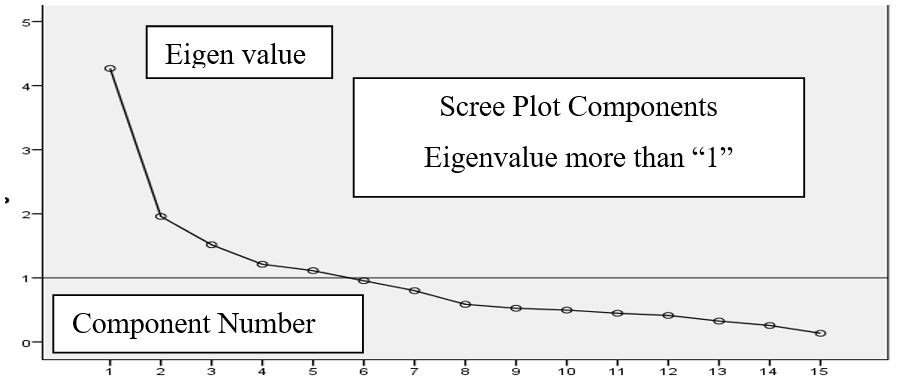
Figure 3:
Representation of components on scree plots based on eigenvalue 1.
