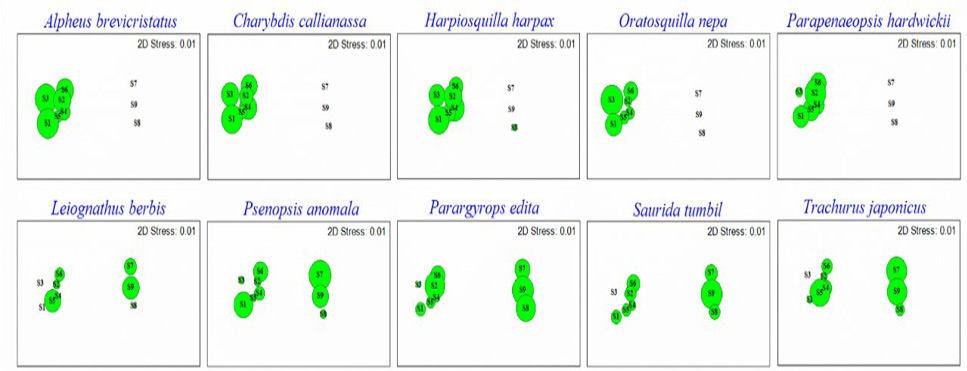
Fig. 4.
Distribution pattern of the dominants contributing to spatial heterogeneity of nekton community based on NMDS analysis (the size of the bubbles showing the abundance of the dominants species).
Distribution pattern of the dominants contributing to spatial heterogeneity of nekton community based on NMDS analysis (the size of the bubbles showing the abundance of the dominants species).