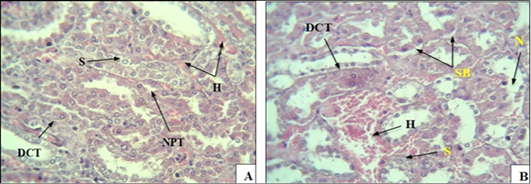
Figure 3
(A): A cross-section of kidney tissue in rats with induced diabetes, showing severe bleeding between the urinary tubules (H), , especially the proximal tubule (NPT), swelling (S). (B): Section showing necrosis (N) of the cells of some urinary tubules, swelling (S), separation of cells from the basement membrane (SB), narrowing of the lumen of some tubules collection of separated epithelial cells in the middle DCT tubule, swelling (S), H bleeding (H & E 40x).
