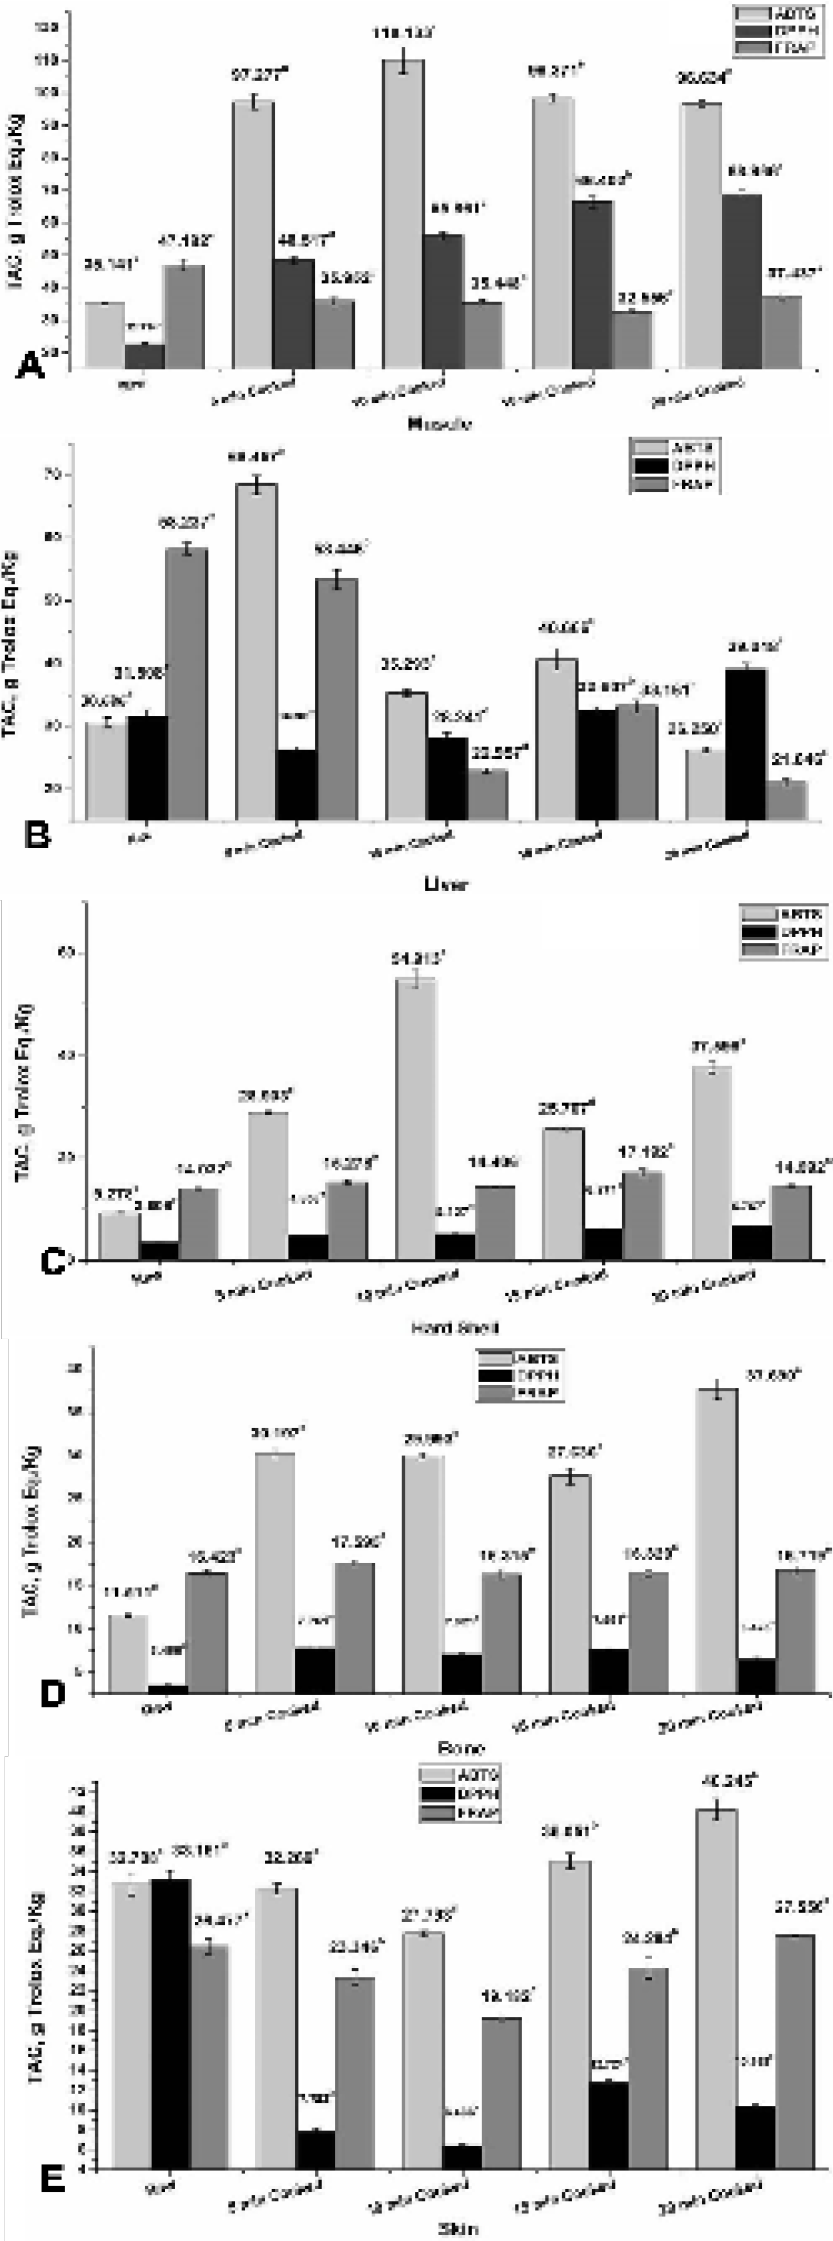
Fig. 2.
Effects of heating at 180°C for 5, 10, 15, and 20 min on total antioxidant capacity of (ABTS, DPPH, and FRAP values) muscle (A), liver (B), hard shell (C), bone (D) and skin (E) of Chinemys reevesii. Each bar indicates mean values of sample. Vertical bars are standard deviation. Different small letters indicate significant differences (n=3, p < 0.05).
