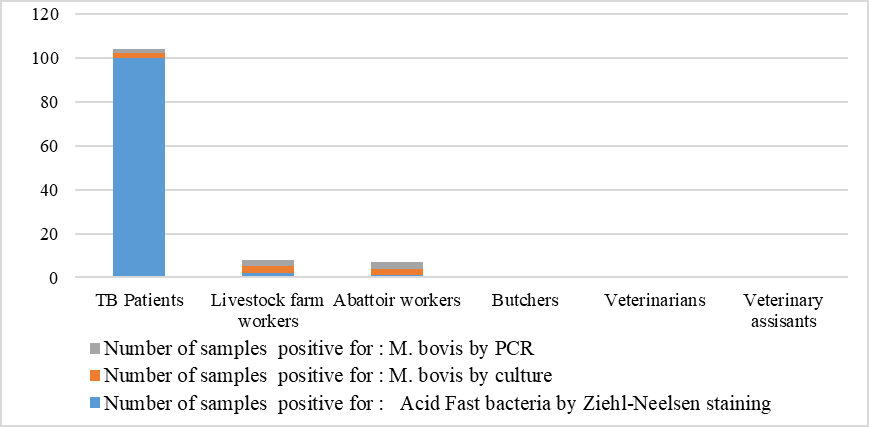
Figure 2:
Graph showing the overall results of Ziehl-Neelsen staining, Culture and PCR of the occupational groups in the study area.
Graph showing the overall results of Ziehl-Neelsen staining, Culture and PCR of the occupational groups in the study area.