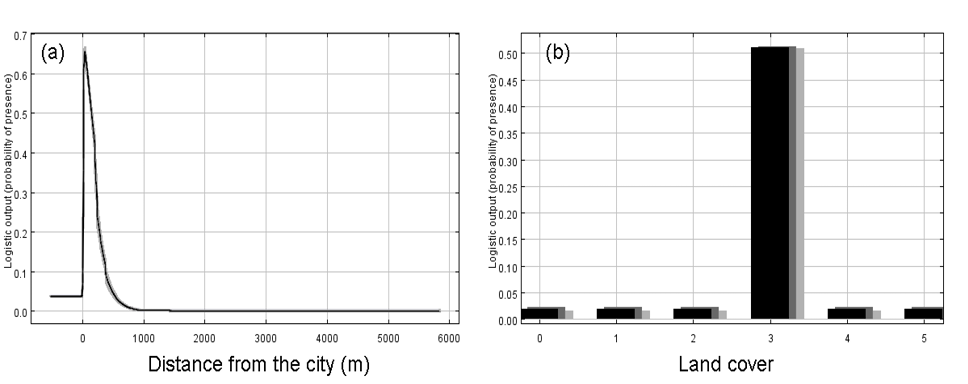
Fig. 2.
Response curves showing the relationships between the probability of breeding colonies of egrets and herons and two top habitat variables (Distance from the city, Land cover). The curves show the mean response of the 10 replicate model runs (black) and the mean +/- one standard deviation (light gray, two shades for Land cover variables).