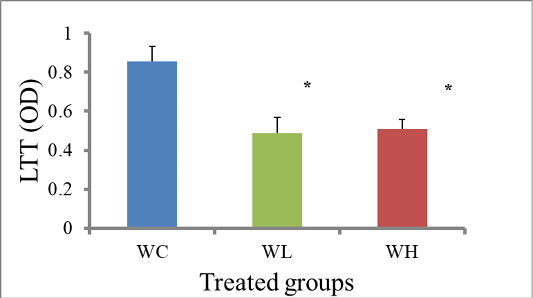
Figure 3:
Effect of dietary soy phytoestrogens withdrawal on LTT (OD) in ovariectomized female albino rats. Data is expressed as mean ±SE. (*) denotes a statistical (p< 0.05) difference between the treated groups and the control. p-value for the WL group compared to the control is p=0.03, while the estimated p-value for the WH group compared to the control is p=0.02.
