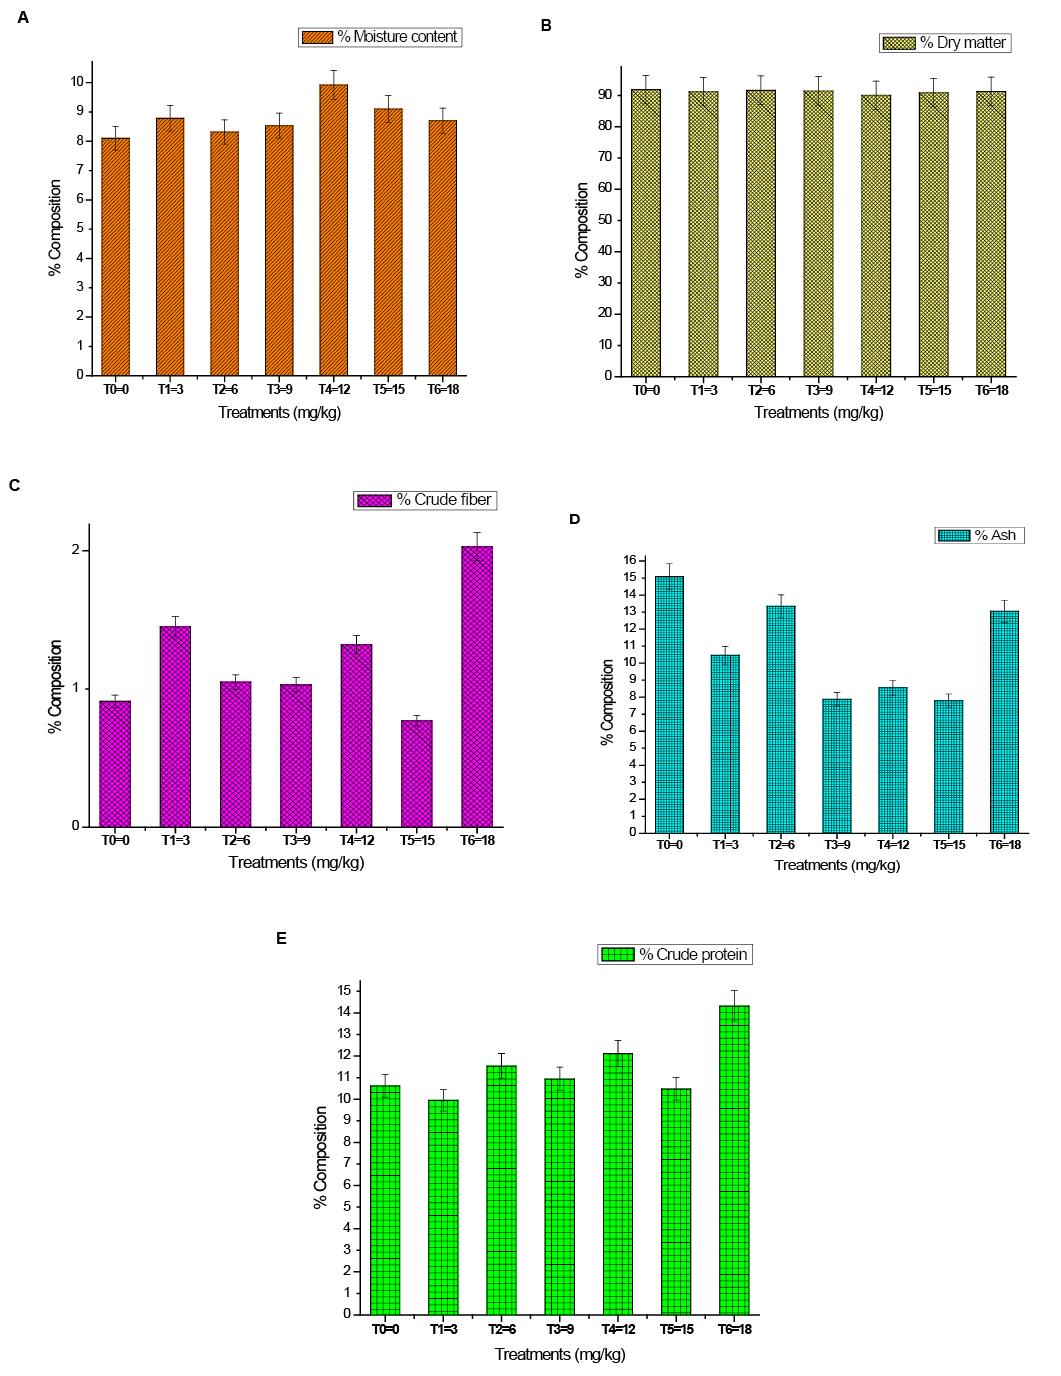
Figure 4:
Different amount of nutrients detecting in wheat under B stress at different treatments (A) % Moisture content, (B) % Dry matter yield, (C) % Crude fiber, (D) % Ash, (E) % Crude protein.
Different amount of nutrients detecting in wheat under B stress at different treatments (A) % Moisture content, (B) % Dry matter yield, (C) % Crude fiber, (D) % Ash, (E) % Crude protein.