Fig. 4.
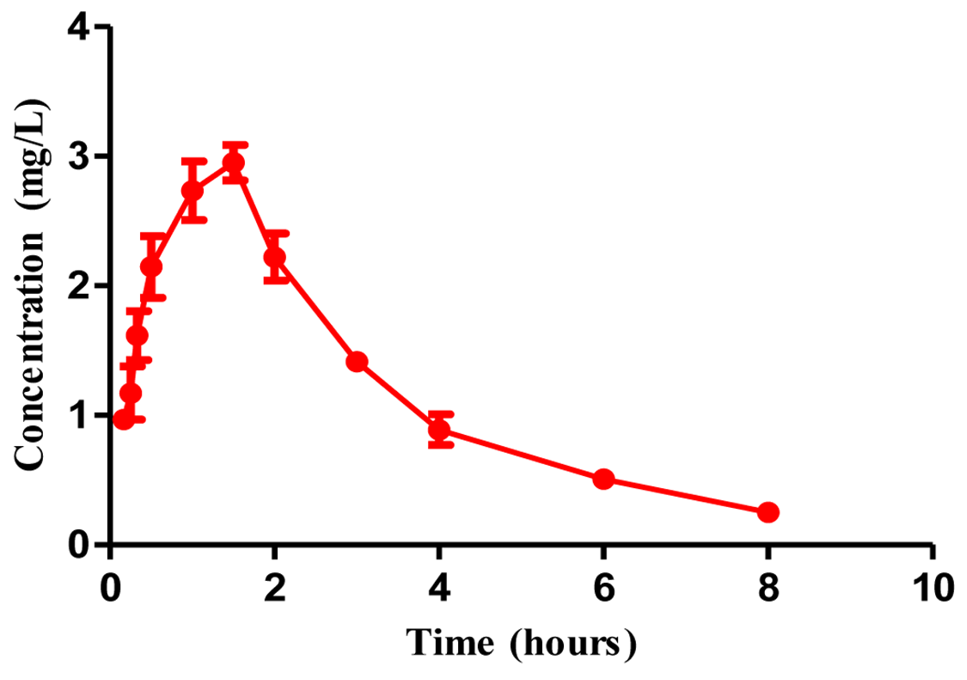
Plasma concentration of cefquinome (Mean±SD)versus time curve after I/M administration (1.25mg/kg) in cattle (n=4).
Plasma concentration of cefquinome (Mean±SD)versus time curve after I/M administration (1.25mg/kg) in cattle (n=4).