
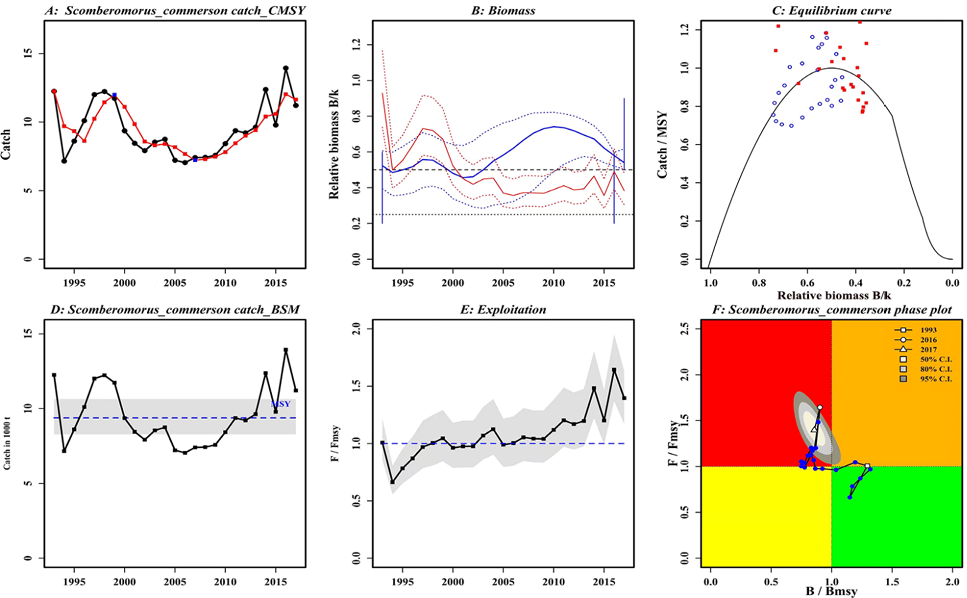
Estimated results of CMSY and BSM method for Somberomorus commerson (A) Time series of catch (black line) and moving average (red line) (B) Relative biomass estimated by CMSY (blue lines) and BSM (red lines) (C) curve estimated by CMSY (blue dots) and BSM (red dots) (D) Time series catch (E) Exploitation rate (F) Kobe plot of S. commerson stock status B/BMSY and fishing mortality ratio F/FMSY indicating (Red = Overfished, Dark yellow = Overfishing, Yellow = Recovering and Green = Safe zone). Blue circles represent the estimated trajectories (1993-2017) of the Indo-Pacific Spanish mackerel fishery in WIO, Pakistan. Grey shaded area denotes 50%, 80% and 95% confidence interval. The symbols falling in each quadrant are defined in the legend (right upper corner).