View larger version:
Download Original File
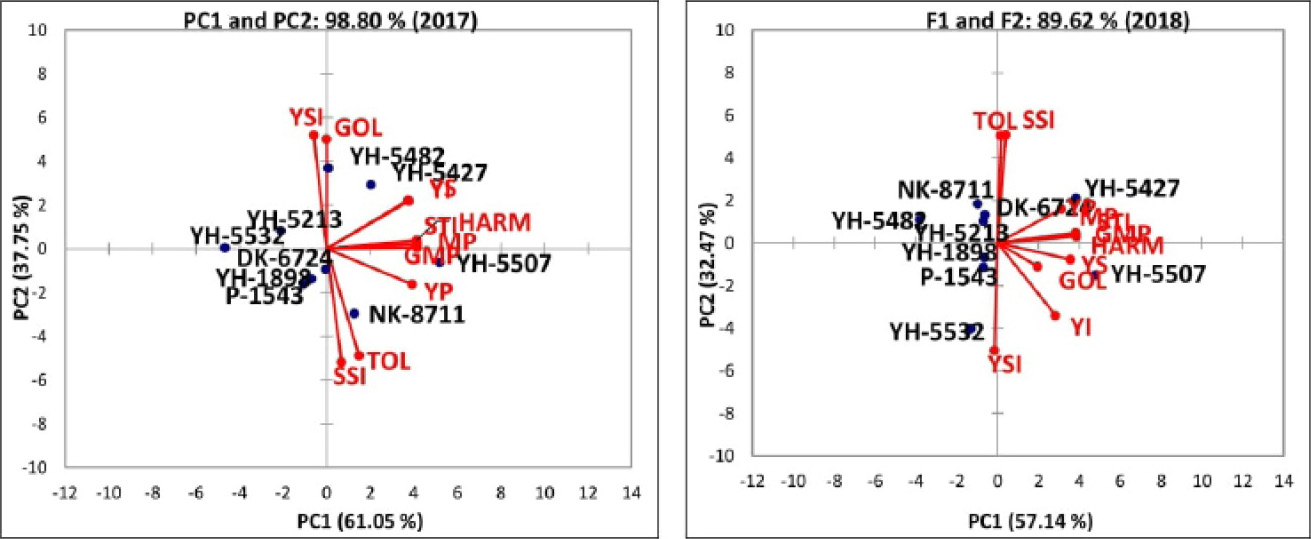
Figure 3:
PC-1 and PC-2 biplot of stress tolerance indices for the year 2017 and 2018.
