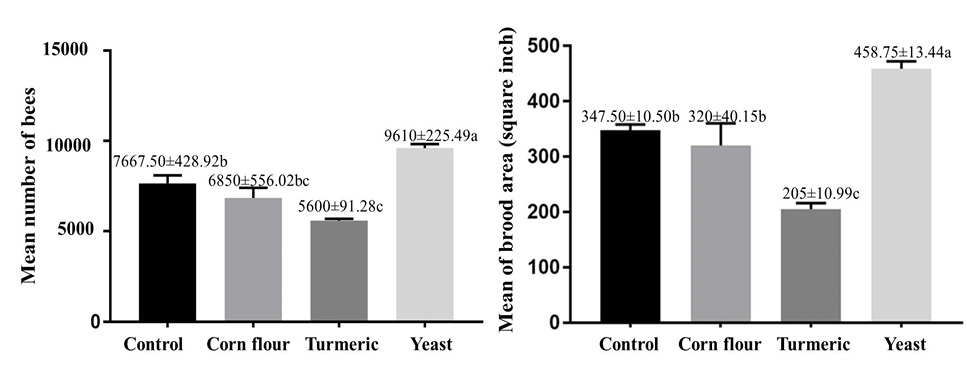
Fig. 3.
Variations in mean number of bees and brood area between the four feeding groups. Means±SE are presented, and letters present significant variations between groups according to Tukey test.
Variations in mean number of bees and brood area between the four feeding groups. Means±SE are presented, and letters present significant variations between groups according to Tukey test.