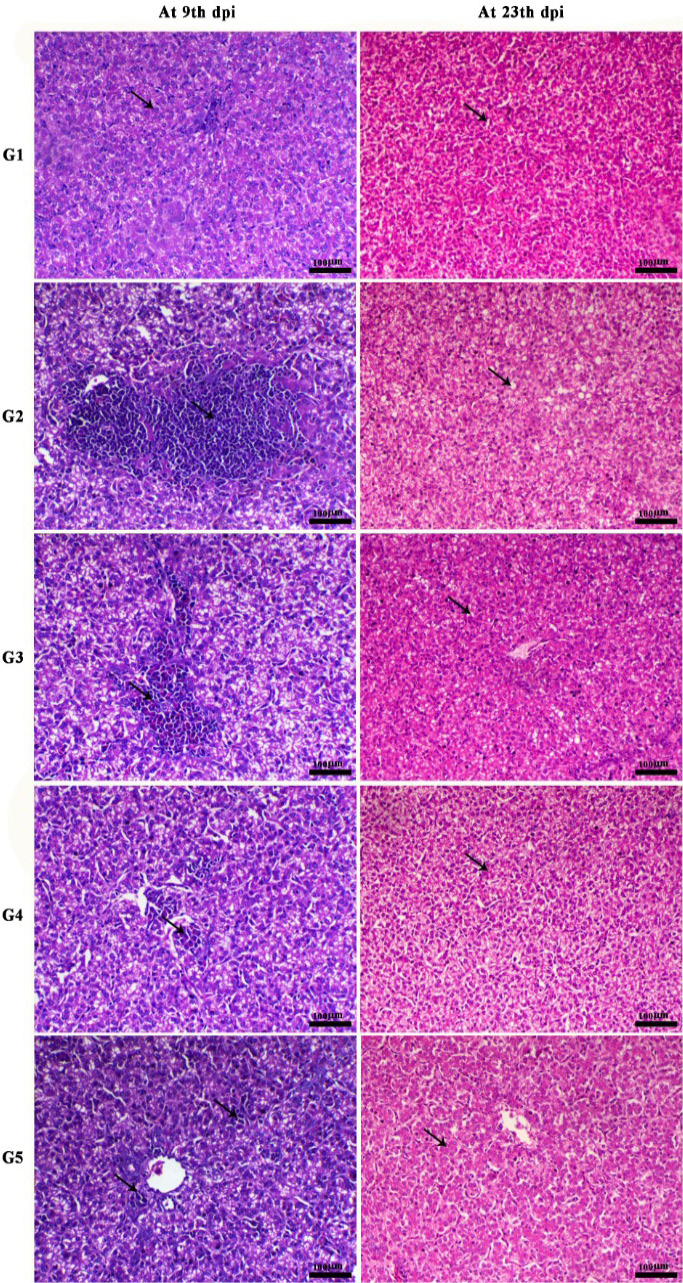
Histological structure of liver showing normal hepatocytes (arrow) at 9th and 23rd dpi., in non-infected non treated chicken (G1), necrotic foci associated with mononuclear cells infiltration (arrow) 9th dpi. and a moderate degree of fat hepatic vacuolation (arrow) at 23rd dpi., in infected non treated chicken (G2), periportal eosinophilic cells infiltration (arrow) at 9th dpi. and a mild degree of hepatic vacuolation (arrow) at 23rd dpi., in infected chicken treated with cashew oil (G3), small area of periportal eosinophilic cells infiltration (arrow) at 9th dpi. and normal hepatocytes (arrow) at 23rd dpi., in infected chicken treated with toltrazuril (G4), a mild degree of mononuclear and eosinophilic cells infiltration (arrows) at 9th dpi. and normal hepatocytes (arrow) at 23rd dpi., in infected chicken treated with cashew oil + toltrazuril (G5), H & E, X200.
