
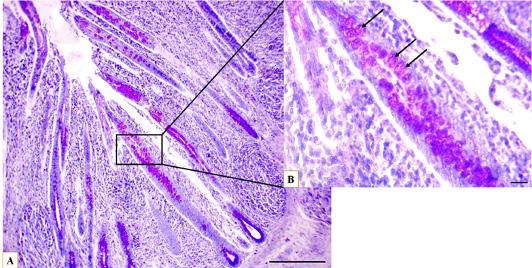
Figure 7:
Microphotographs show the glycosaminoglycans distribution through the caecum, at proximal portion (A), the longitudinal crypt (B) GAGs containing goblet cells (arrows), toluidine blue stain, (A) Scale bar=200 µm, (B) Scale bar=20 µm.