Fig. 2.
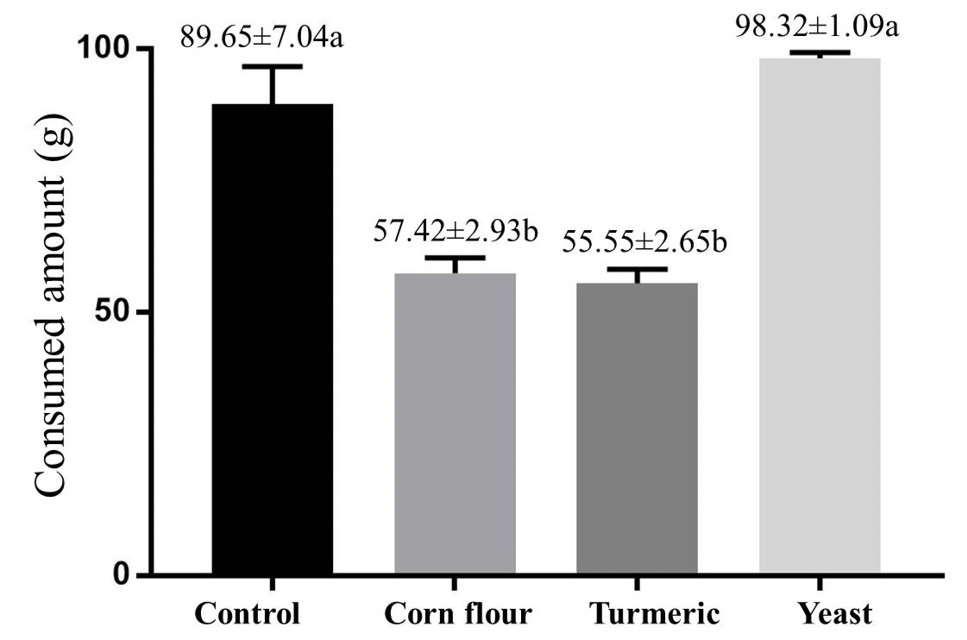
The amount of each feeding type consumed after 72h (mean±SE). Letters denote the significant differences between feeding types according to Tukey test.
The amount of each feeding type consumed after 72h (mean±SE). Letters denote the significant differences between feeding types according to Tukey test.