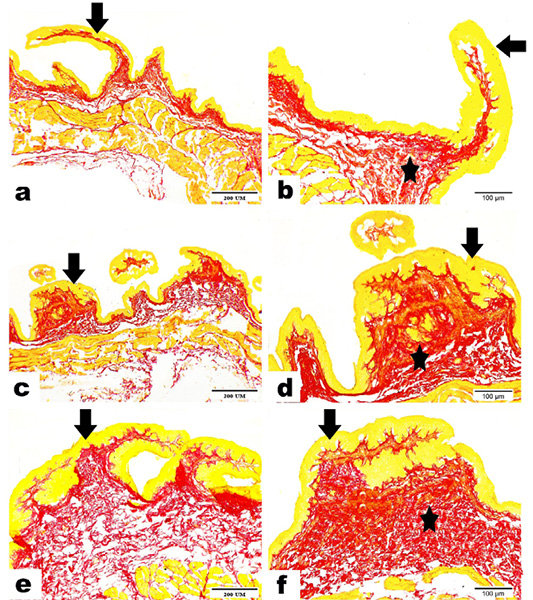
Figure 15:
Photomicrographs exposing the impact of DOSS and SLS on collagen deposition in rumen tissues as follows: (a, b, c) Control Group displaying normal epithelium (arrow) and a few amounts of collagen fibers (star). (d, e, f) DOSS Group: demonstrated hyperplasia of epithelium (arrow) as well as moderate deposition of collagen fibers (star). (g, h, i) SLS Group: highlighted epithelium with intense hyperkeratosis and hyperplasia (arrow), as well as extreme proliferative collagen fibers (star). Collagen fibers were labelled in red, while non-collagen proteins were marked in orange. (Sirius Red, Magnification power: x100, x200).
