Figure 3:
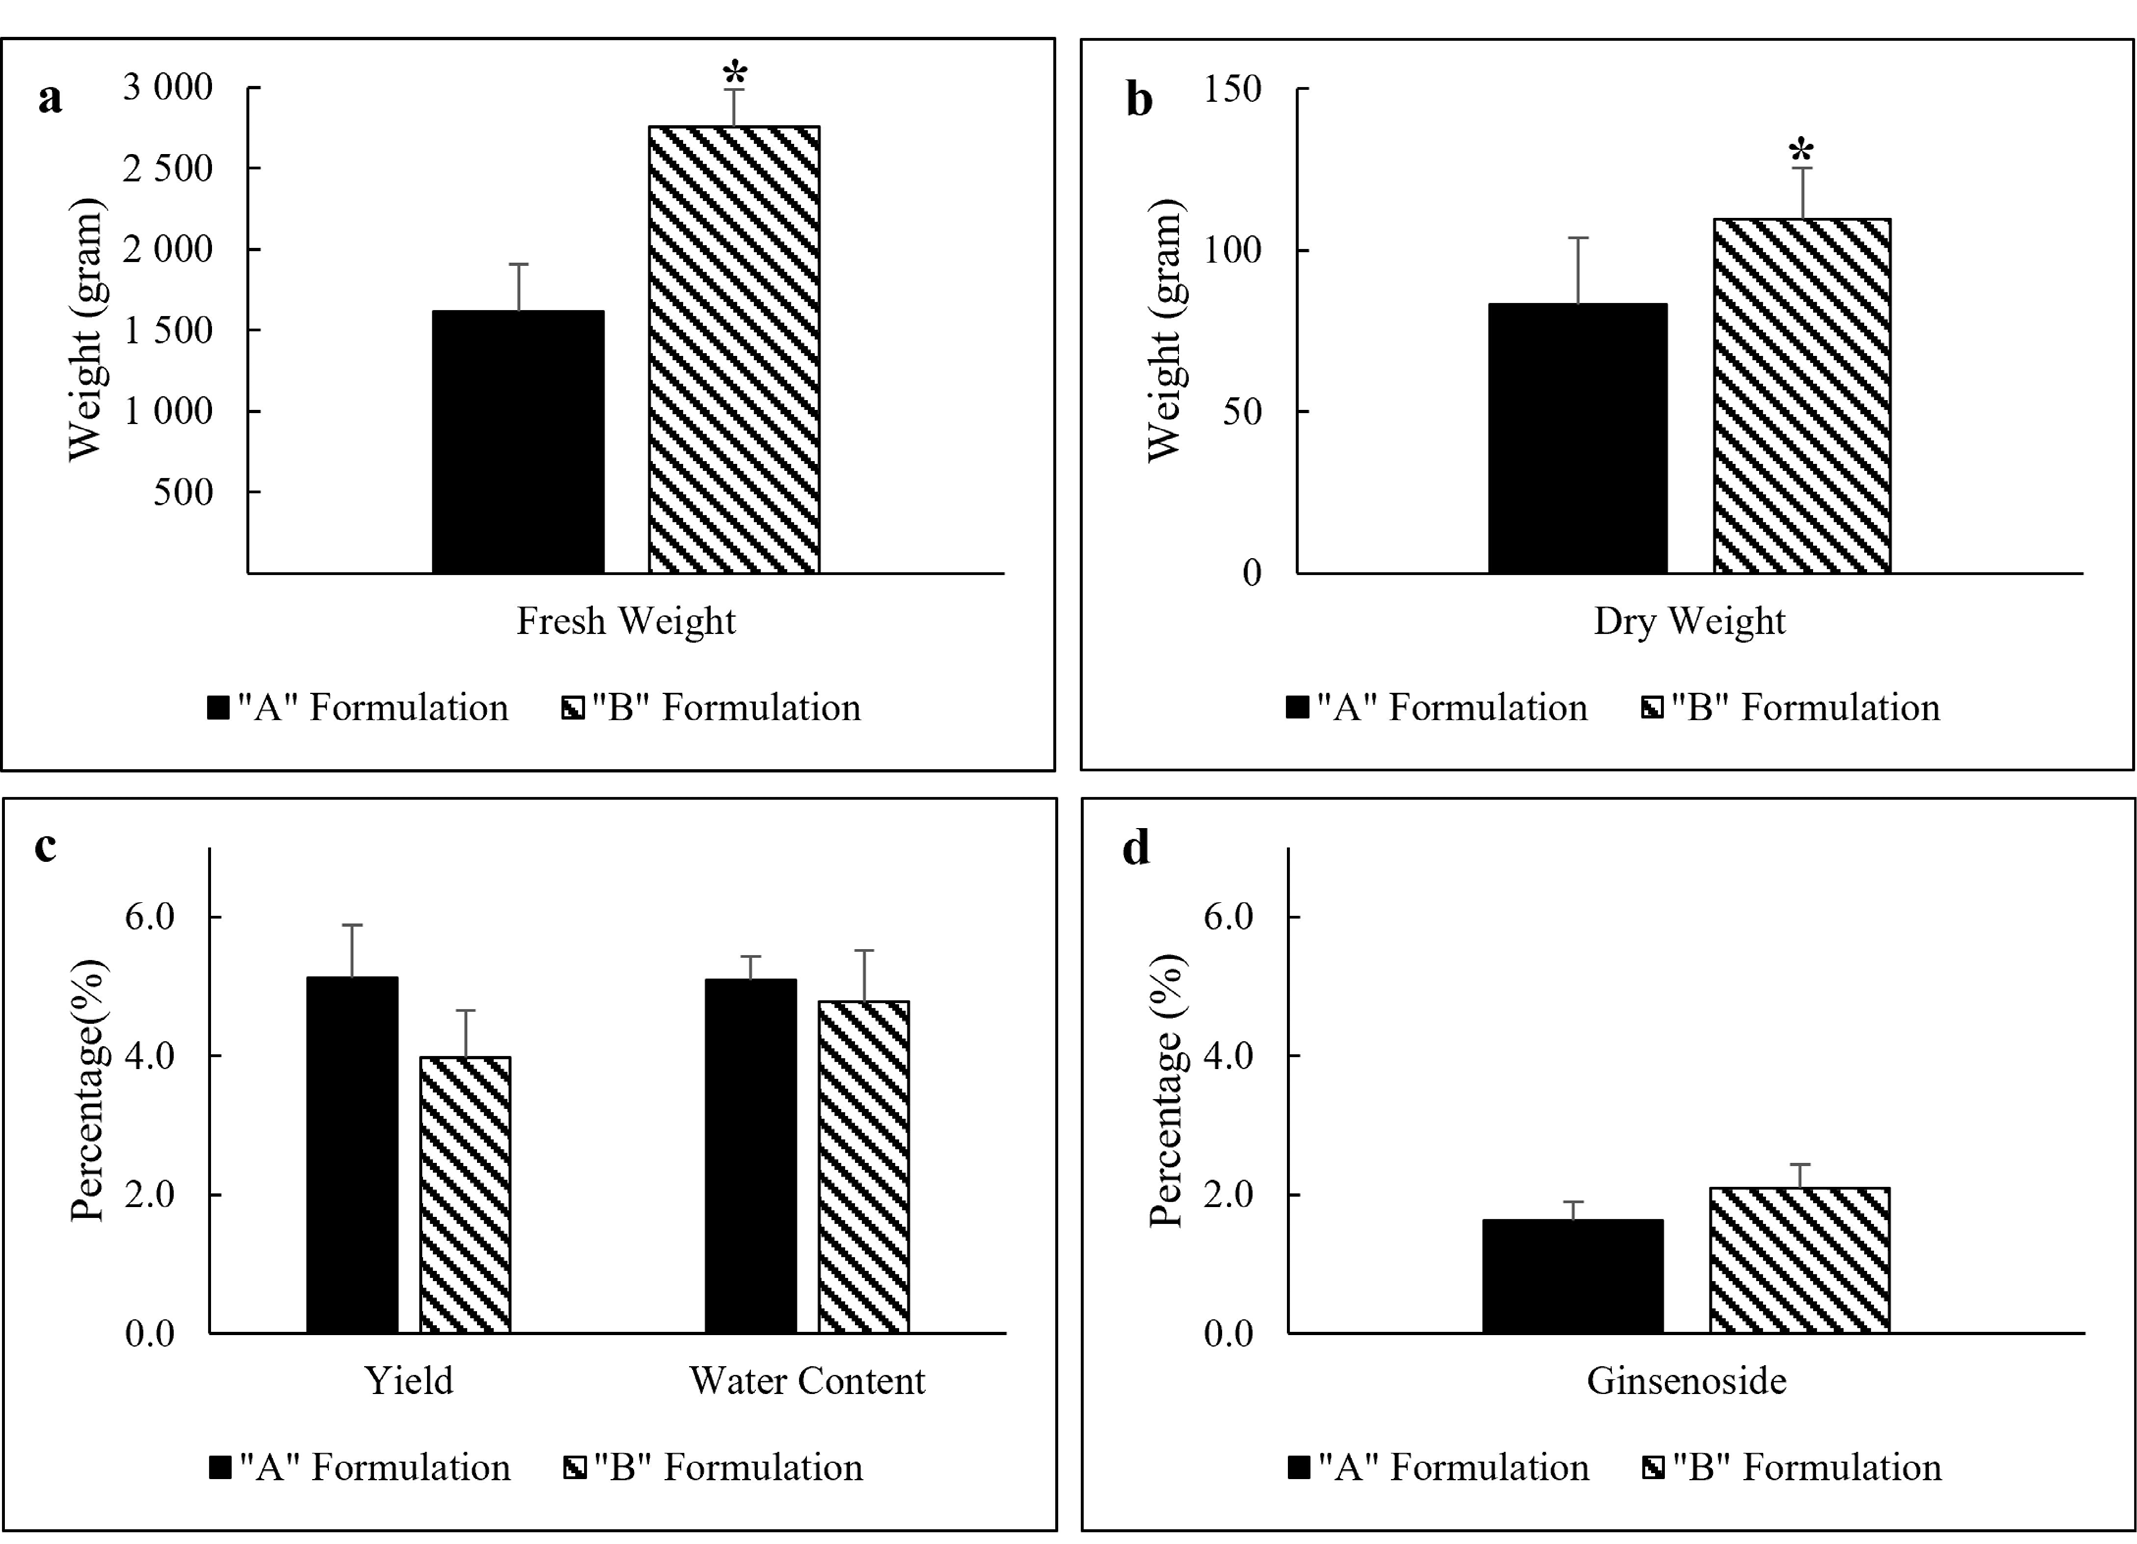
Bar chart of the effect of medium formulation on a) fresh weight, b) dry weight, c) yield percentage and water content, and d) ginsenoside content. Values are means ± SD (n > 3).
Bar chart of the effect of medium formulation on a) fresh weight, b) dry weight, c) yield percentage and water content, and d) ginsenoside content. Values are means ± SD (n > 3).