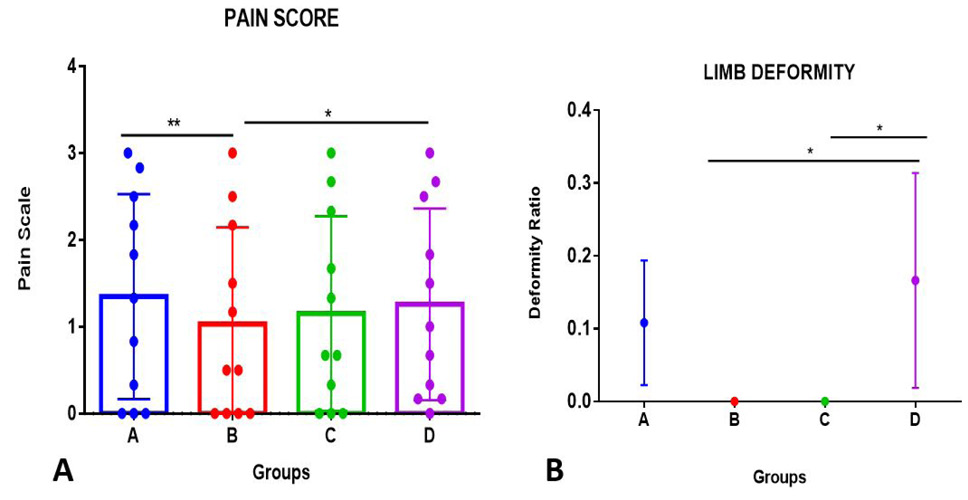
Fig. 5.
Changes in pain score (A), limb deformity (B) in each group with time points. For pain score and limb deformity, significant difference of values i.e., * (P ≤ 0.05), **(P ≤ 0.01) of groups A, B, C and D was noted at marked days.
Changes in pain score (A), limb deformity (B) in each group with time points. For pain score and limb deformity, significant difference of values i.e., * (P ≤ 0.05), **(P ≤ 0.01) of groups A, B, C and D was noted at marked days.