
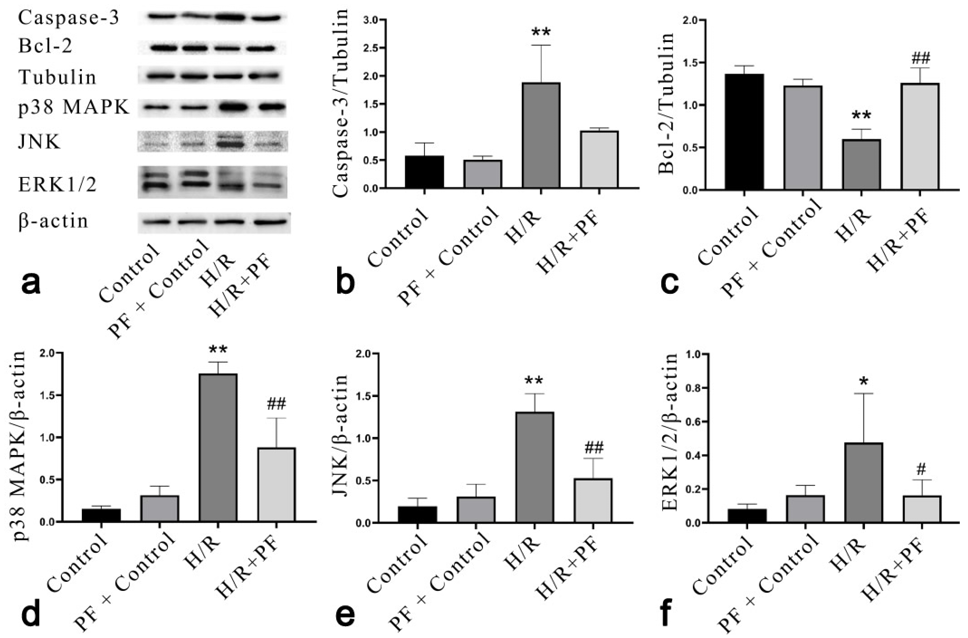
Fig. 5.
Representative picture of Caspase-3, Bcl-2, p38 MAPK, ERK1/2, and JNK in H9C2 cell of each group (a), and Effect of PF on the expression of Caspase-3 (b), Bcl-2 proteins (c), p38 MAPK (d), JNK (e), and ERK1/2 (f) proteins in H9C2 cells.
Notes: x̄ ± s, n=3; * P <0.05, ** P <0.01, compared with control group; # P <0.05, ## P <0.01, compared with H/R group.