View larger version:
Download Original File
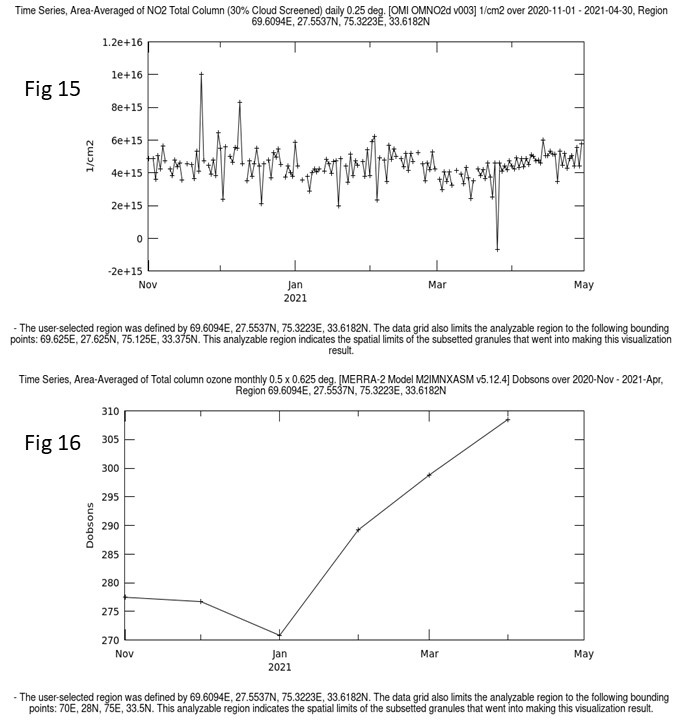
Figure 15: Variation in NO2 values of different atmospheric pollutants.
Figure 16: Variation in O3 values throughout WGP.
