
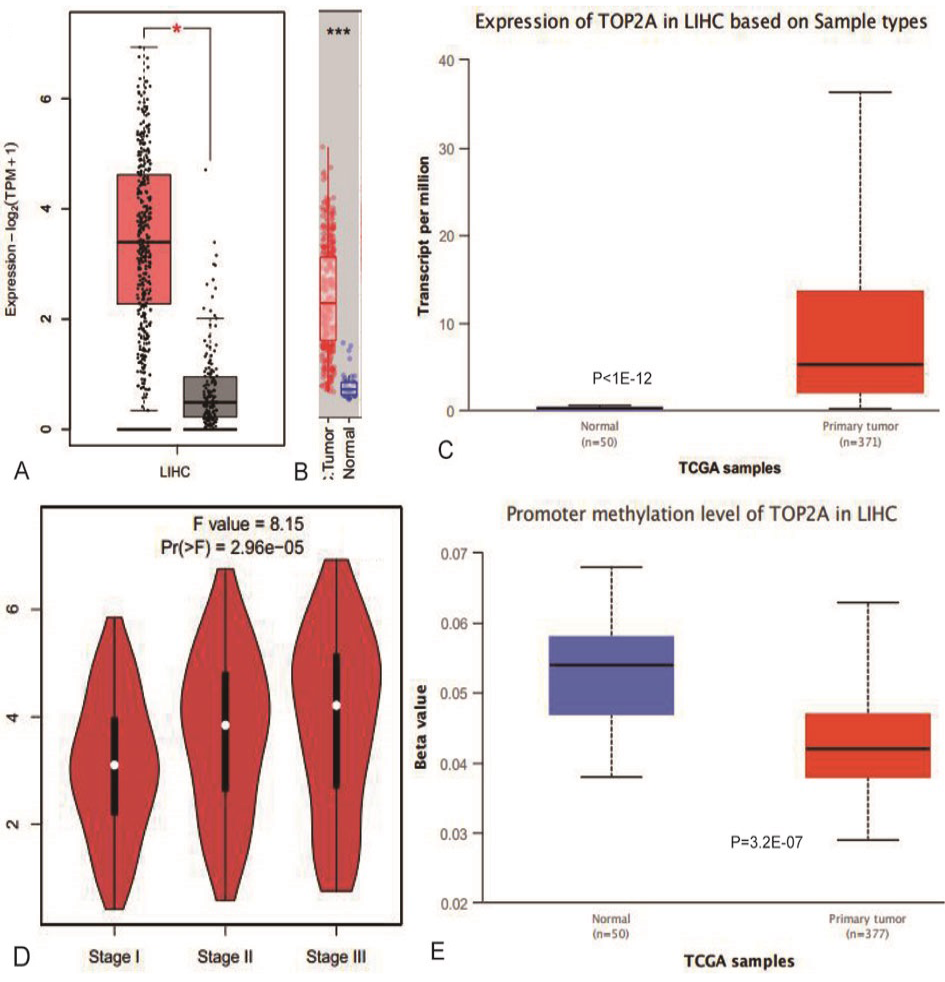
Fig. 1.
The correlation between gene expression and clinical stages, gene methylation levels, and expression levels of TOP2A genes analyzed by different tools in tumor and normal tissues. A: GEPIA2; B: TIMER; C: Ualcan; D: The correlation between gene expression and clinical stages; E: methylation level.