View larger version:
Download Original File
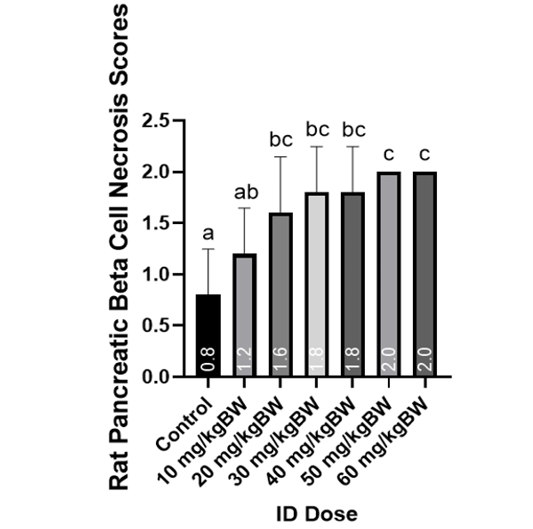
Figure 2:
Graph of rat pancreatic beta cell necrosis score with iron excess conditions.
Note: Different letters indicate the results of Mann-Whitney U analysis, indicating significant differences between treatments (P<0.05).