
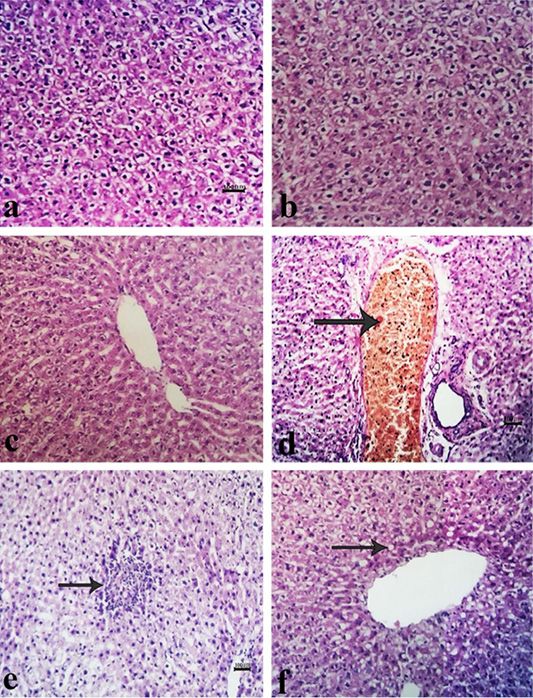
Figure 2:
Liver sections of rats on day 17 of the experiment showing (a, b, c) normal hepatic tissue. Moderate blood vessel congestion (arrow), perivascular edema, bile duct hyperplasia, and degenerated hepatocytes (d). A mild focal area of fibroblastic proliferation (arrow) along with mild to moderate vacuolar degeneration of hepatocytes (e). Mild vacuolation of hepatocytes (arrow) (f). (a) control group; (b) Phyllanthus niruri (PN)group; (c) Plantago major (PM) group; (d) CCl4 group; (e) PN-CCl4 group; (f) PM-CCl4 group.