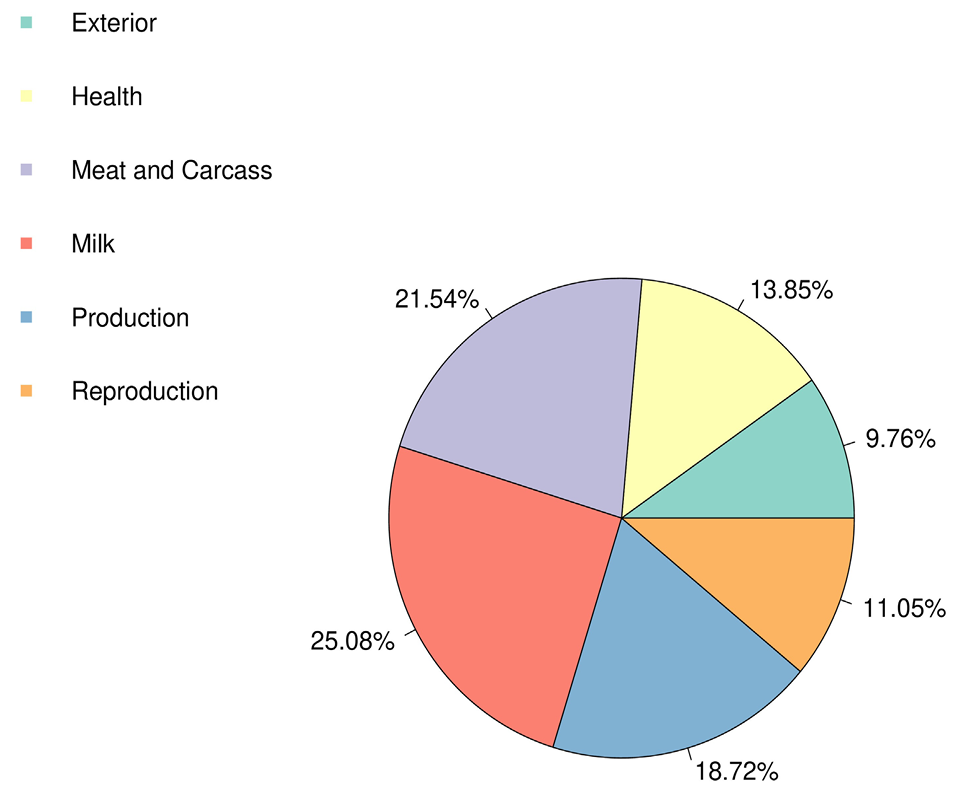
Pie plot shows the part of six quantitative trait loci (QTL) classes annotated in the substantial genomic areas.