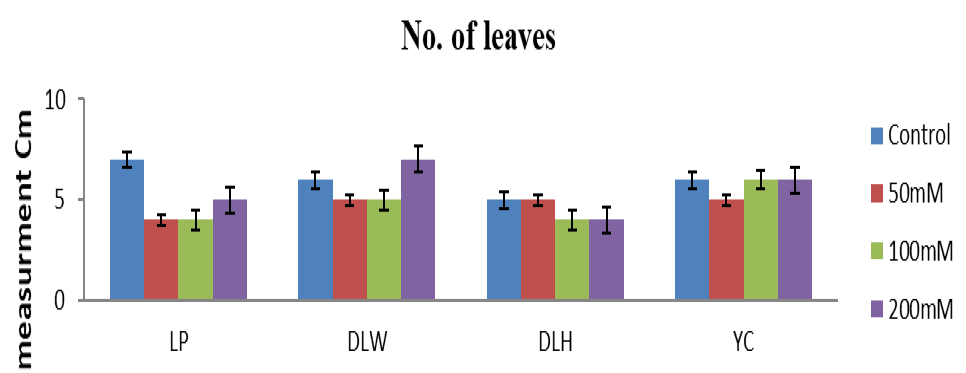
Graphical representation of number of leaves of four different regions under control and salt stress.