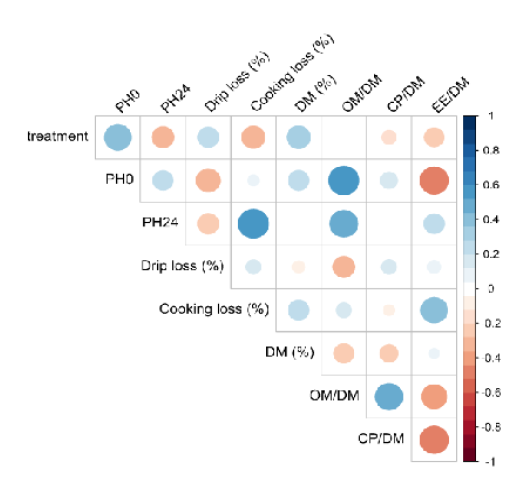
Figure 2:
Correlation plot with Spearman method of pH values, drip loss, cooking loss and chemicals of breast meat of Minhdu chicken and the treatments given (GARL0, GARL1, GARL2, GARL3). The legend on the side of the plot shows the coefficient values corresponding to the color graduation. The value of correlation is proportional to the size of the inner circle and color intensity (blue = positive, red = negative). Abbreviations: pH0: initial pH; pH24: values of pH after 24 hours; DM (%): dry matter percentage; OM/DM: organic matter/dry matter; CP/DM: crude protein/dry matter; EE/DM: ether extracts/dry matter.