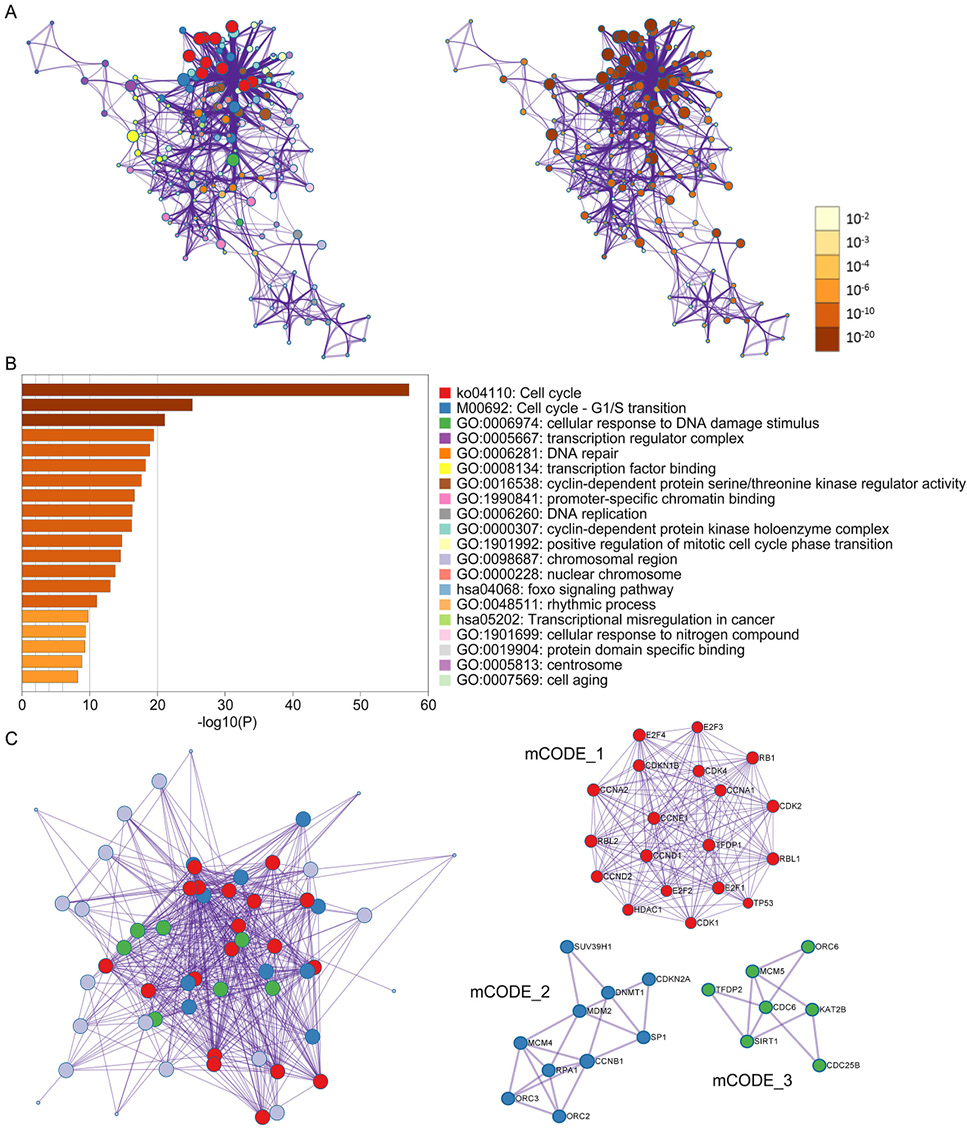
Fig. 6.
Enrichment analysis of SET7/9- and E2F1-correlated proteins in PPI network. (A) The cnetplot of KEGG and GO analysis of SET7/9- and E2F1-correlated proteins. The functional terms and relative q values of each node were shown in the left and right panel. (B) Top 20 enriched terms of proteins in the PPI network. (C) Clustering analysis using Cytospace-mCODE. The overall PPI network colored by different cluster and three clustered PPI networks were shown in the left and right panel. Red, proteins clustered to mCODE_1. Blue, protein clustered to mCODE_2. Green, proteins clustered to mCODE_3.