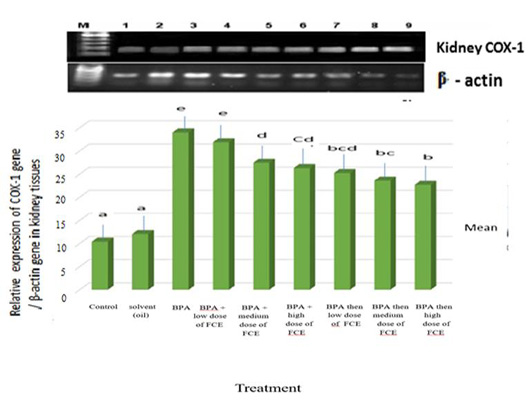
Figure 4:
Gene expression levels of COX-1 gene in kidney tissues of male rats that had been treated with FCE against BPA assayed by semi-quantitative RT-PCR. Recovery rate of mRNA was estimated as the ratio between the intensity of COX-1 gene and the β-actin gene. The means with different letters are significantly different (P<0.05). M=DNA ladder. Lane 1=normal control. Lane2=solvent (oil). Lane 3=BPA. Lane 4=BPA+low dose of FCE. Lane 5=BPA+medium dose of FCE. Lane 6=BPA+ high dose of FCE. Lane 7=BPA then low dose of FCE. Lane 8=BPA then medium dose of FCE. Lane 9=BPA then high dose of FCE.