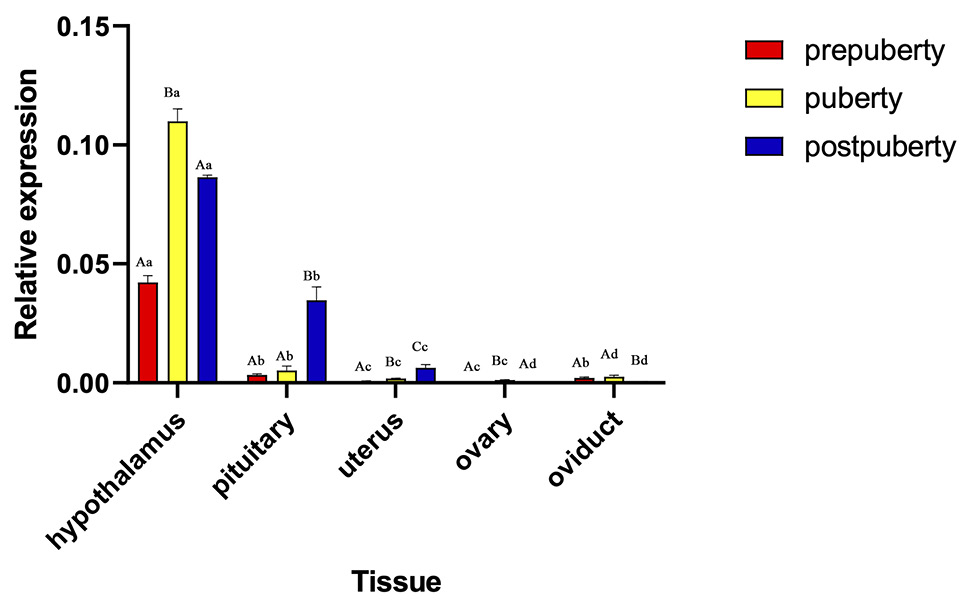
Fig. 6.
The relative expression levels of TTR gene in different tissues at different puberty stages of Dolang sheep. (1): Values of the same tissues, different periods with different capital letter superscripts indicate significant differences (P < 0.05), whereas with the same capital letter or no letter superscripts, there was no significant difference (P > 0.05). (2): Values of the same period, different tissues with different small letter superscripts indicate significant difference (P < 0.05 ), while with the same small letter superscripts, there was no significant difference (P > 0.05 ).
