
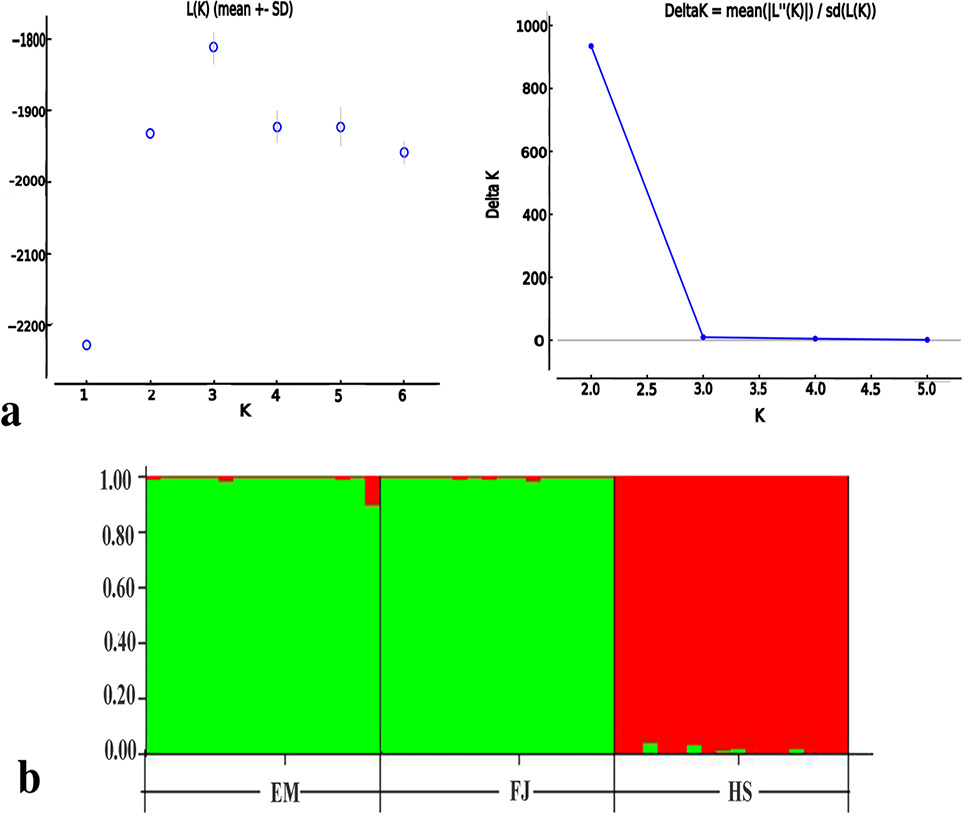
Fig. 2.
Genetic structure analysis of M. thibetana based on 26 SNP loci. (a) Estimation number of genetic clusters (K) from 10 independent runs for K=1-6. The left panel shows the rate of change (ΔK). The right panel shows the mean of test Ln probability of data. K=2 shows the most posterior probabilities of the K values (b) The colors indicated the likely proportion of inferred clusters that each individual may assigned to. The EM and FJ individuals were assigned the similar genetic clusters, while HS individuals assigned the other distinct cluster. The sampling areas of the individuals are shown at the bottom. HS, Husangshan-Yulinkeng; EM, Emei mountain-Shengtai houqu; FJ, Fanjingshan-huilongwan.