
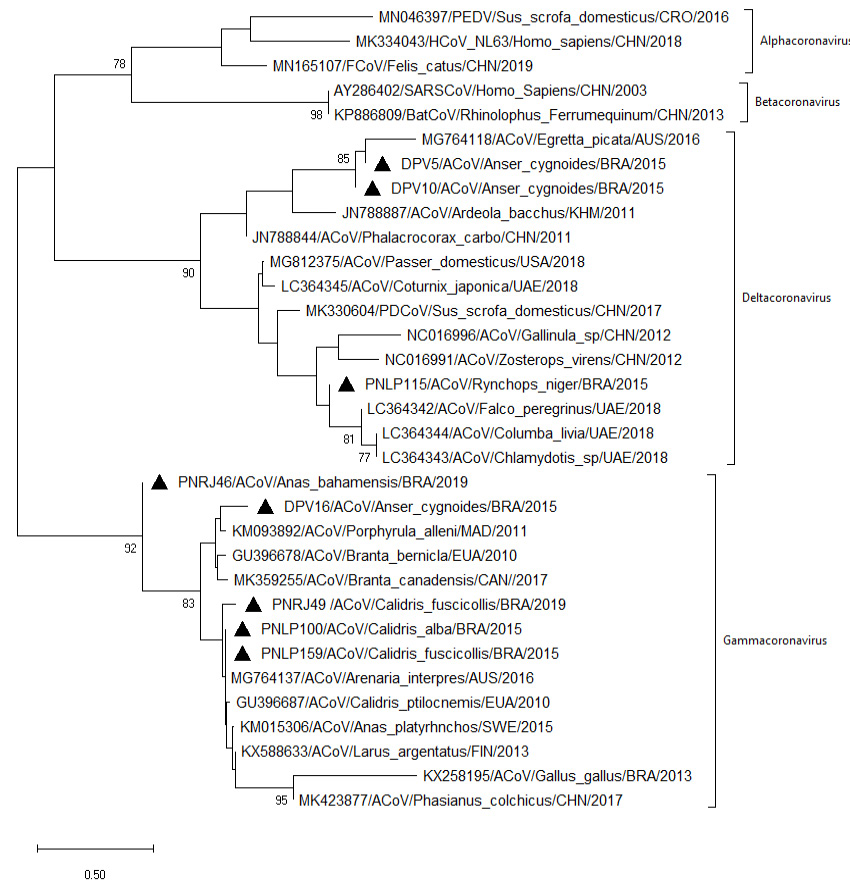
Figure 2:
Nucleotide neighbor-joining distance tree (Tamura 3-parameter substitution model) for the partial RdRp (440 bp) showing the known groups. Strains detected in the present study are preceded by black triangles. The numbers at each node are bootstrap values greater than 70 from 500 replicates. The bar represents the number of substitutions per site.